No graph but link works

Hi,

Think it’s kind a follow up on this Thread but…

I turned on “Enable Link” so the picture in icinga2 is Clickable.

And when I click it it will show the right graph in Grafana:

But icinga2 is still showing this:

Followed different howto’s but mostly this one (google translate):
LINK
github
It seems that alot of documentation is getting out of date but think most of the above link is still fine and my Grafana is working good and icinga2 is working to. Just the visual graphs dont show.

What could be the problem or what am I missing?

You are using direct mode, so you need to make sure that the user can reach the grafana server and also that anonymous access is granted for Grafana.

I would xswitch to indirect-proxy mode and use a auth token for Grafana.

Regards,
Carsten

Hi Carsten,

I will definately try that to! Here is comes: ‘but…’ :slight_smile:
…because the (single) user (icinga2 admin) can just click the link in icinga2 and see the grafana graph without authorisation I thought the grafana access part would be fine, dont you think so?

Thx for the fast reply!

The docs say if you use direct mode, the user have to be logged in or you allow anonymous access.
The difference is that in direct the browser of the user fetches the image, in proxy mode the webserver fetches the image and serve it.

Thanks for explaining. Gonna try your advice and report back!
Thx!

While looking for icinga2 grafana api examples, I found an reference to grafana.ini and “allow_embedding = true” . That seemed to do the trick but now you made me curious and I want to find out how to get this api access working :wink:

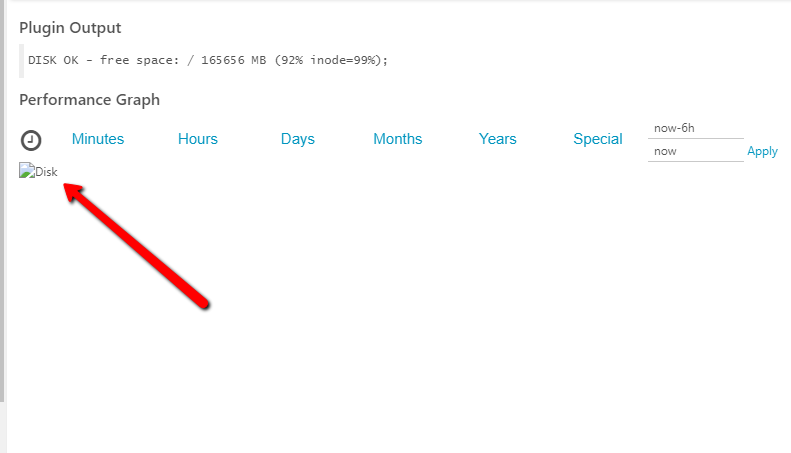
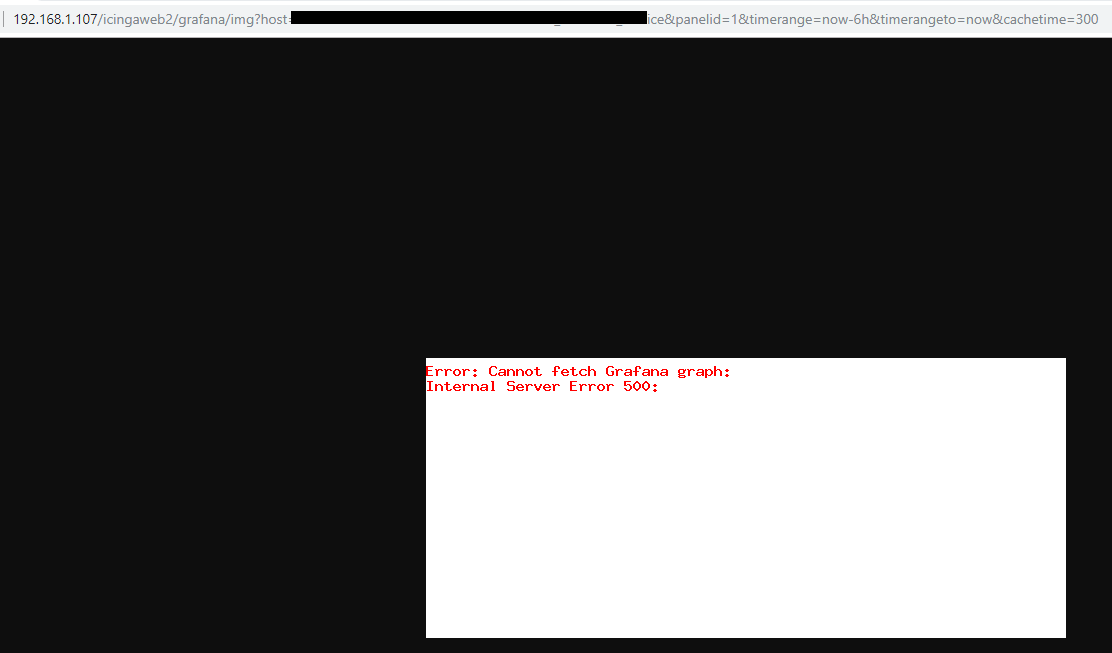
For now I created a API key in grafana and changed the configuration in icinga2 to indirect proxy and set the api key in there. Still investigating, but for now I get an internal server error 500 in icinga2.

Any good examples/references will help.

thx

(Disabled anonymous access in grafana.ini and restarted service)

The api works testing with curl:

Icinga2 config:

Debug output:

Putting the debug data in the browser directly gives me the same image as in icinga2, no idea if this is BS or not, but maybe it helps

Now the output when copy pasting the icinga2 url using Curl with the API authorization:

It’s showing that I’m missing something but I’m lost…hope you have another hint.

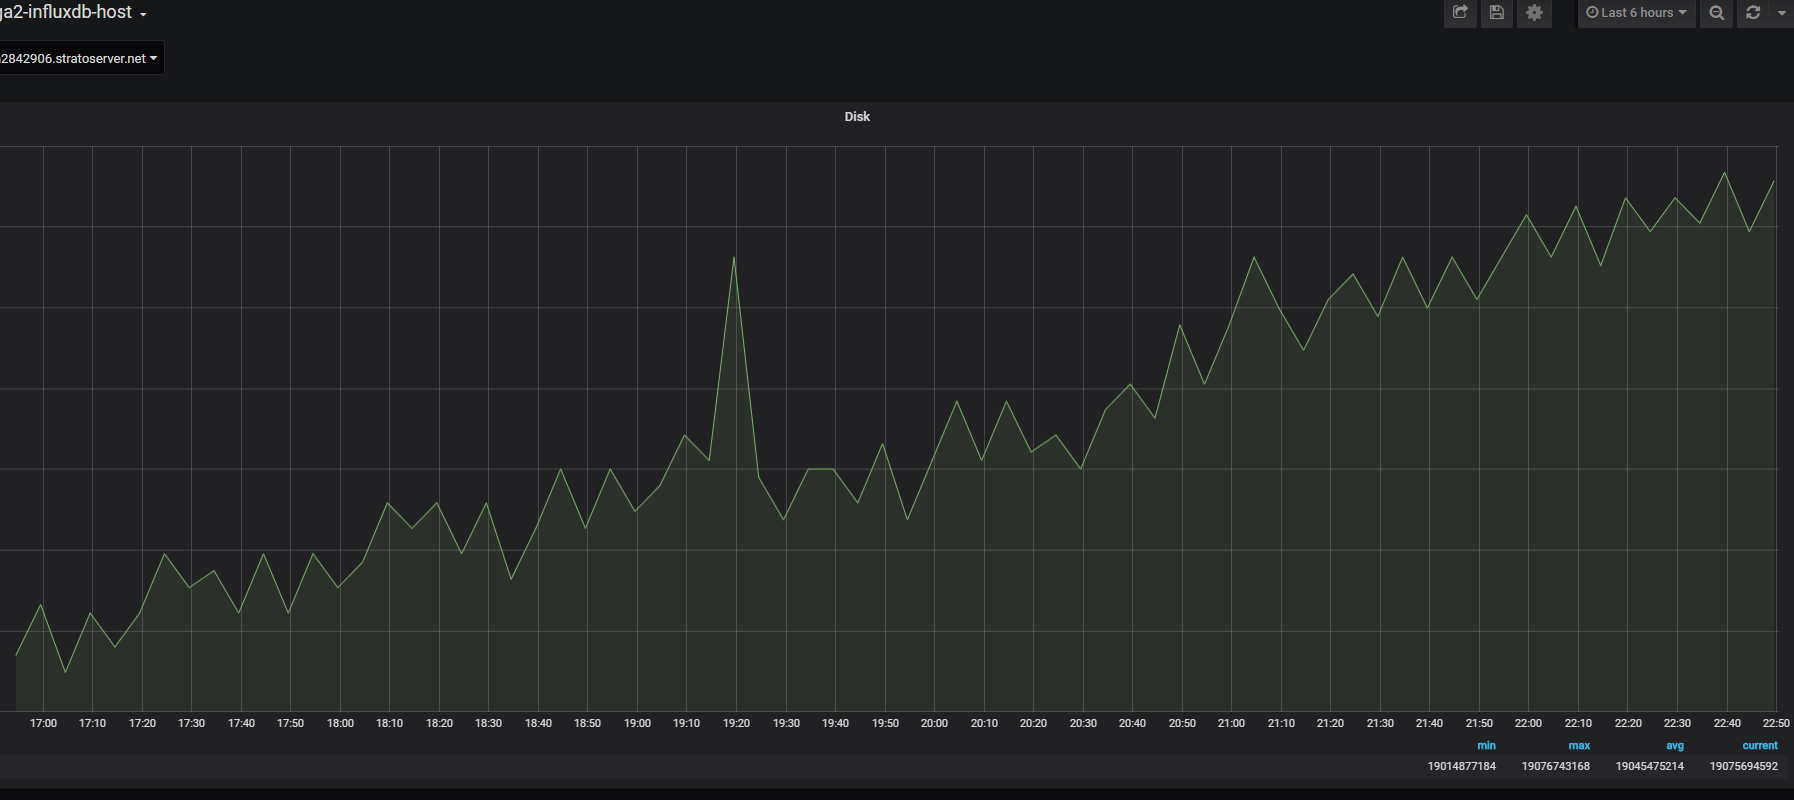
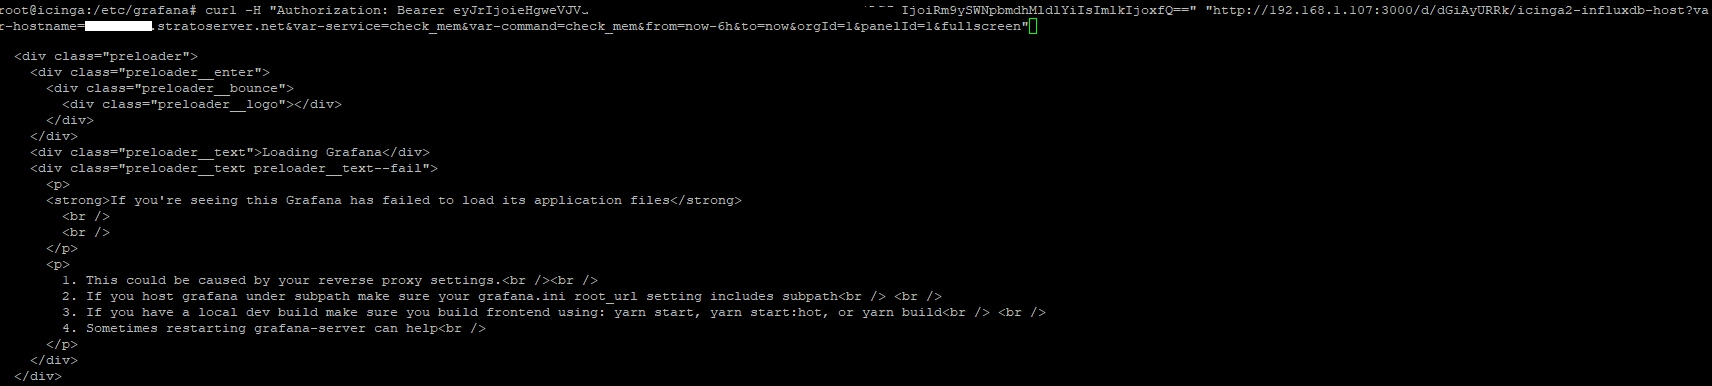
Tried another thing that was used here and it’s called Modify Header info chrome extention. Filling in the api key like describes shows me that I can see the graphs in grafana using the api key… So in my eye’s there must be something wrong with Icinga not using the authentication header api key to retreive the graph ?!

What OS are you using and how did you install Grafana? Maybe a look into the syslog will give more details.
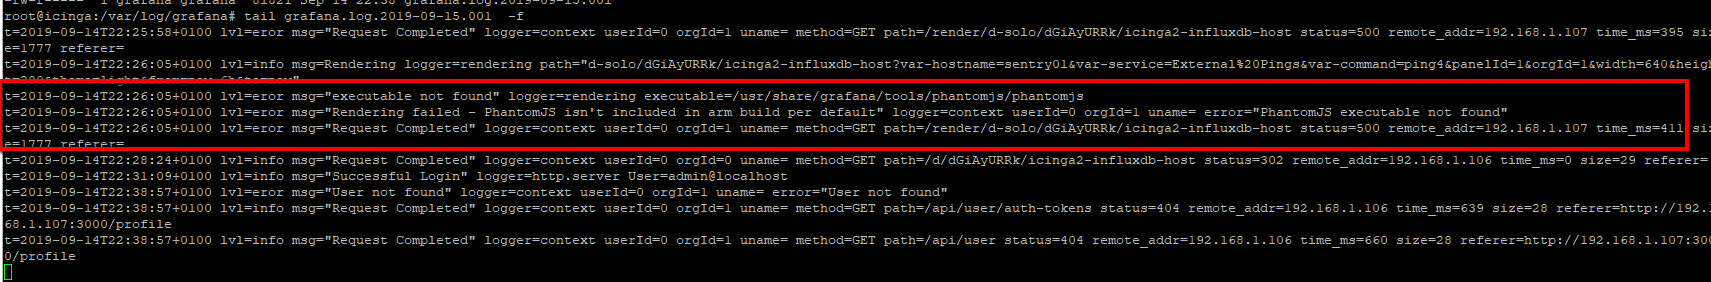
I think the API is not the problem, more that the renderer of Grafana is missing something.

Some steps I’ve taken to install it on RPI:

install grafana ( https://grafana.com/grafana/download?platform=arm )
wget https://dl.grafana.com/oss/release/grafana-rpi_6.3.5_armhf.deb
sudo dpkg -i grafana-rpi_6.3.5_armhf.deb

grafana module for icinga
cd /usr/share/icingaweb2/modules
git clone https://github.com/Mikesch-mp/icingaweb2-module-grafana.git grafana

I think there are the fonts missing, can you check the syslog for any messages from grafana while view a host/service object and also watch syslog during startup of grafana. The message you posted shows that grafana has problems to load something during renderer run.

Just found that you should run

sudo apt-get upgrade
sudo apt --fix-broken install

after instaling Grafana package.

updated and restarted grafana-server. Unfortunately it didnt seem to solve the problem.

then check the syslog about messages.

Found this article, Grafana on Pi doesnt contain the phantom.js renderer anymore :frowning: You have to use Chrome Headless now.

Also turned on and referred log to /var/log/grafana/grafana.log

[log]
filters = rendering:debug

It indeed shows an error in the log:

It talking about phantomJS missing ?

Reading “Also I note that the plugin has been updated recently so the instructions may not be accurate.” )-:

You can also install phantomjs yourself

But you have to copy it to the right location i think.

yarn install --pure-lockfile

PhantomJS seems not to solve the problem if this guy is right. (14 days ago)

This is also a possibility:

Using grafana-cli

NOTE: Installing this plugin using grafana-cli is supported from Grafana v6.4.

grafana-cli plugins install grafana-image-renderer

But I have:

Grafana cli version 6.3.5

Is it possible to upgrade to 6.4 on RPI ? Suggestion how ?

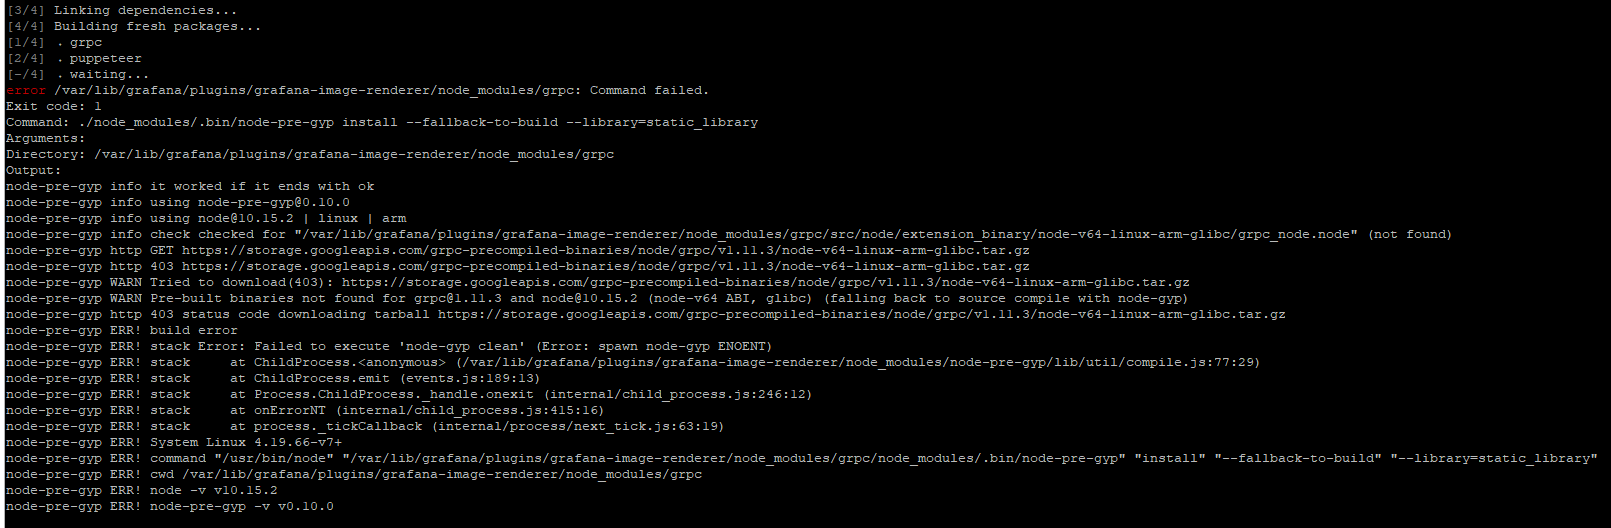
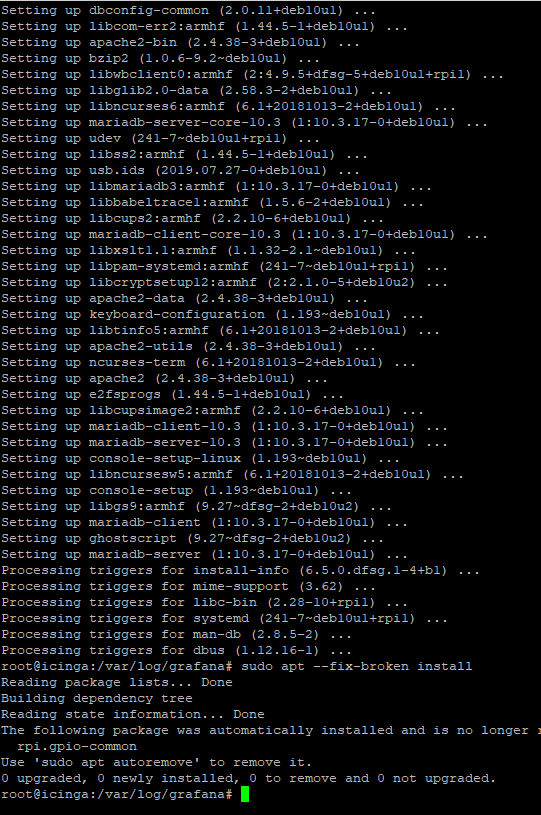
Tried multiple bin files but all give the same errors:

root@icinga:/home/pi# ./phantomjs --version
./phantomjs: error while loading shared libraries: libssl.so.1.0.2: cannot open shared object file: No such file or directory
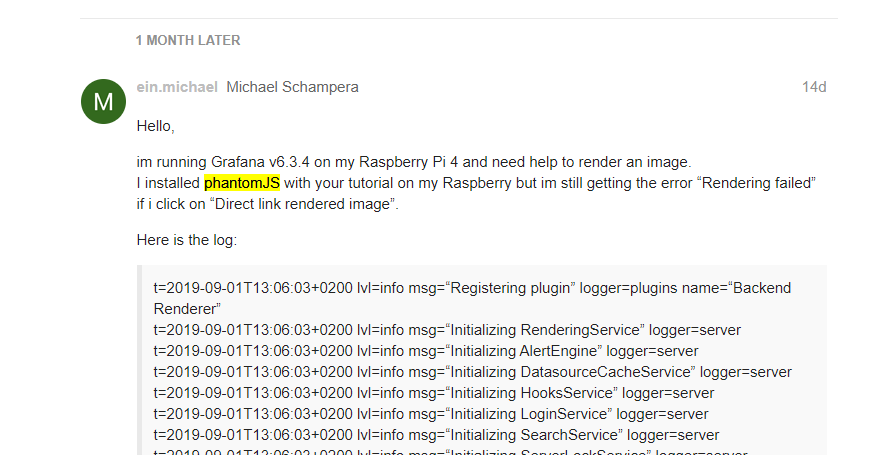