I used a bunch of icinga2 + director + grafana + influxdb.
after removing the organization from the graphs, all the dashboards disappeared into the grafana, they connected a new data source, began to fill in the dashboards. while in the icinga itself for some reason the graphics were no longer displayed. advise how to return the graphics in icinga
Hi,
please add more details on your setup, see the FAQ. Especially,
- Versions involved
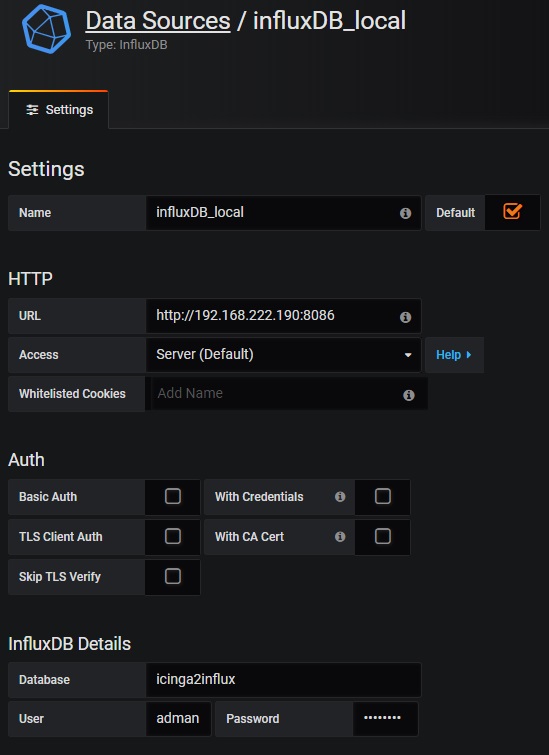
- How exactly does Grafana look like now, how are these data sources configured
- Which module is used to integrate these graphs into Icinga Web 2?
- Error logs from apache, screenshots from the frontend
Cheers,
Michael
$)C
- Versions involved
icinga2 2.6.2 ; director ; grafana 1.3.2 ; influxdb ; debian 9.6
How exactly does Grafana look like now, how are these data sources
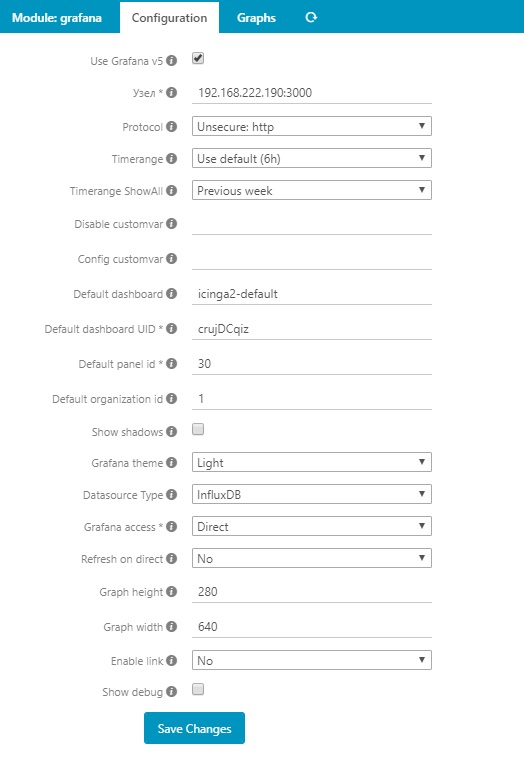
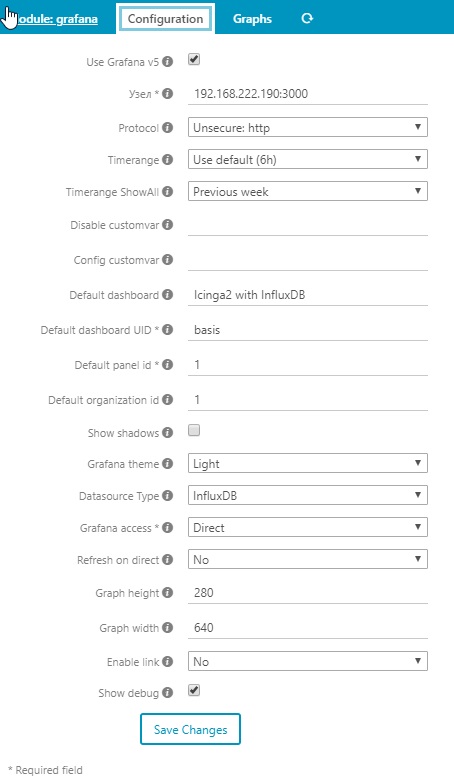
configured : icinga setting - screenshot "1; grafana setting - screenshot "2
Which
module is used to integrate these graphs into Icinga Web 2:
did not quite understand the question. Please clarify
Error
logs from apache, screenshots from the frontend:
access.log - apache ; grafana.log - grafana ; screenshot"` 3
access.log (1.3 MB)
grafana.log (2.69 MB)
Hi,
The screenshot shows the community module by @anon66228339, I was just asking to be sure which category your question fits (moved it accordingly).
Does the Grafana data source verification work down below on the save button? The log says it did not find the datasource…
t=2019-03-25T09:51:11+0300 lvl=eror msg="Alert Rule Result Error" logger=alerting.evalContext ruleId=9 name="jira disk space alert" error="Could not find datasource Data source not found" changing state
Does this work in Grafana itself in the base metrics panel, or your own?
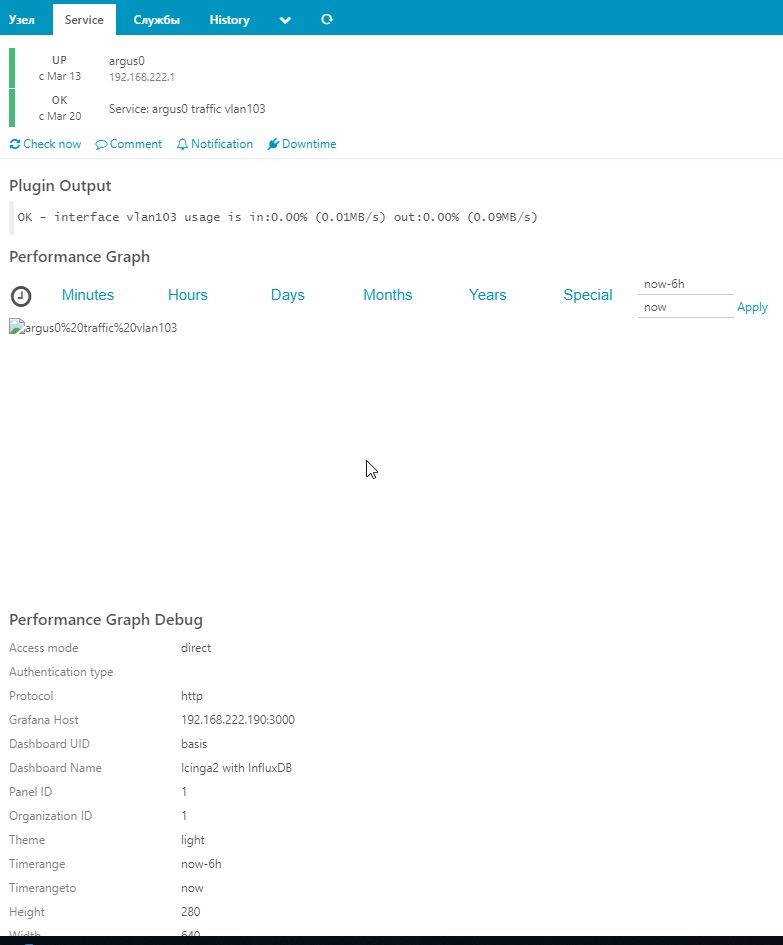
What happens when you right-click on the broken image in the Icinga web detail view and say “open image in a new tab”?
Cheers,
Michael
Iam 100% sure that the default dashboardname and the uuid is not correct. Also please use the provided default dashboard if you are not 100% sure what are you doing. Also iam do not see a authentication configuration, did you create the ini file manualy?
Please do the following steps:
- import the provided default dashboard and configure it correctly (hint name is icinga2-default)
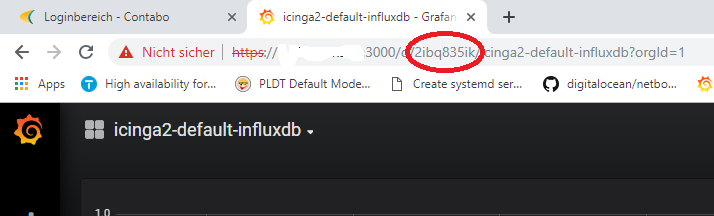
- Get the created uuid for the dashboard, its inside the red circle of the url when you open it in Grafana
- For host checks you need to configure graphs, because the default doesnt work for hostchecks, see the docs
- Check authentication for Grafana, for direct mode you need to enable basic auth or anonymous authentication. But better use API key for authentication for the module against Grafana
best regards,
Carsten
writes what works
writes not found
- this is what is on request icinga2-default: https://grafana.com/dashboards/56
- uuid was set manually
- at the initial launch of icinga, graphs appeared immediately (in icinga) as soon as the polling parameters were configured
4.checked. connects. in basic authentication
Hi,
the Grafana module provides its own dashboards and template panels, those are detected and incorporated then. The linked dashboard is something else, just for Grafana itself.
Did you import the dashboards like described in the docs?
Cheers,
Michael
Yes, that is how they were imported.
maybe I somehow imported the wrong dashboard.
but I looked for grafana.labs and found this one.
If I now replace the initial dashboard, I do not have to redo all the graphics ??
Hi,
that icinga2 dashboard is an example, and to my knowledge, not compatible with the Grafana module ones. I don’t know whether it is possible to move such things around, I’m no Grafana expert. Maybe @anon66228339 knows better.
Can you dump your dashboard to JSON and attach it here to get a better idea?
Cheers,
Michael
Alas, it does not work.
in the form of code - a limit of 3000 characters in the post
as a file - unauthorized extension
I can send the link
Put it into a zip file after export, that can be attached.
!!!THIS DASHBOARD IS NOT MADE TO USE WITH THE GRAFANA-MODULE FOR ICINGAWEB2!!!
icinga2-with-influxdb_rev1 (1).zip (4.0 KB)
This dashboard is in grafana Labs by these parameters. and in a single copy. accordingly, when I see such a picture, I conclude that it should work if I use the parameters that I scored in the search
if there is an initial dashboard that works with grafana + influxdb, I would be very grateful if you send the link.
Did you ever read the documentation of the module? If yes you would know that there a dashboards already provided with the module. And also a howto on how to create dashboards for the module.
have you ever read the documentation with google translator ??)) 90 percent need to be thought out for him as the meaning is lost)) now I will try to make from what’s built in there
Hey,
both of you, calm down a little  We’ll stick with English as our native language is somewhat different, and it is no shame not being an expert in English
According to the docs, you’ll need the following for InfluxDB:
Cheers,
Michael
added both dashboards.
restarted graphan
and icinga2
corrected on the
way ising \ settings \ extensions \ graph
changes:
Charts in ising
did not appear.
when you click
on the picture “open in new window” - not found