Can you share a screenshot from Grafana from both dashboards?
screenshots of dashboards settings or dashboards themselves ??
The dashboards. We need to ensure that the Grafana side is fully working, as otherwise there are no graphs to render and fetch from Icinga Web 2.
If the dashboards are not working, your main task is to find out why and fix them. If the dashboards are working, something else inside the Grafana module configuration or setup may be broken.
Cheers,
Michael
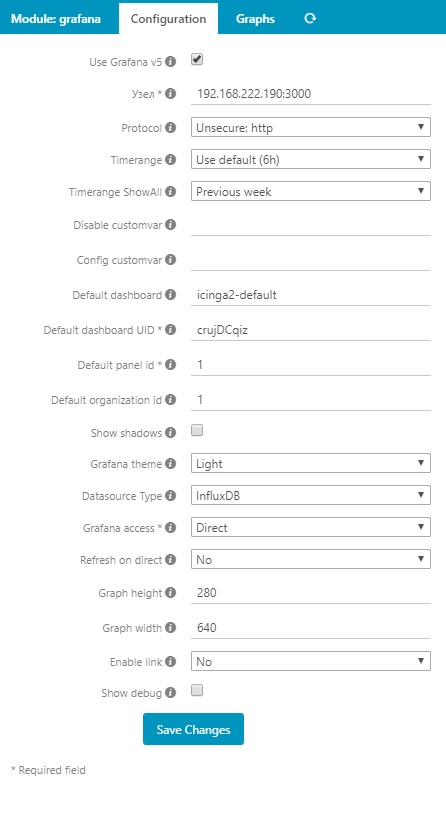
Defaukt panelid is wrong
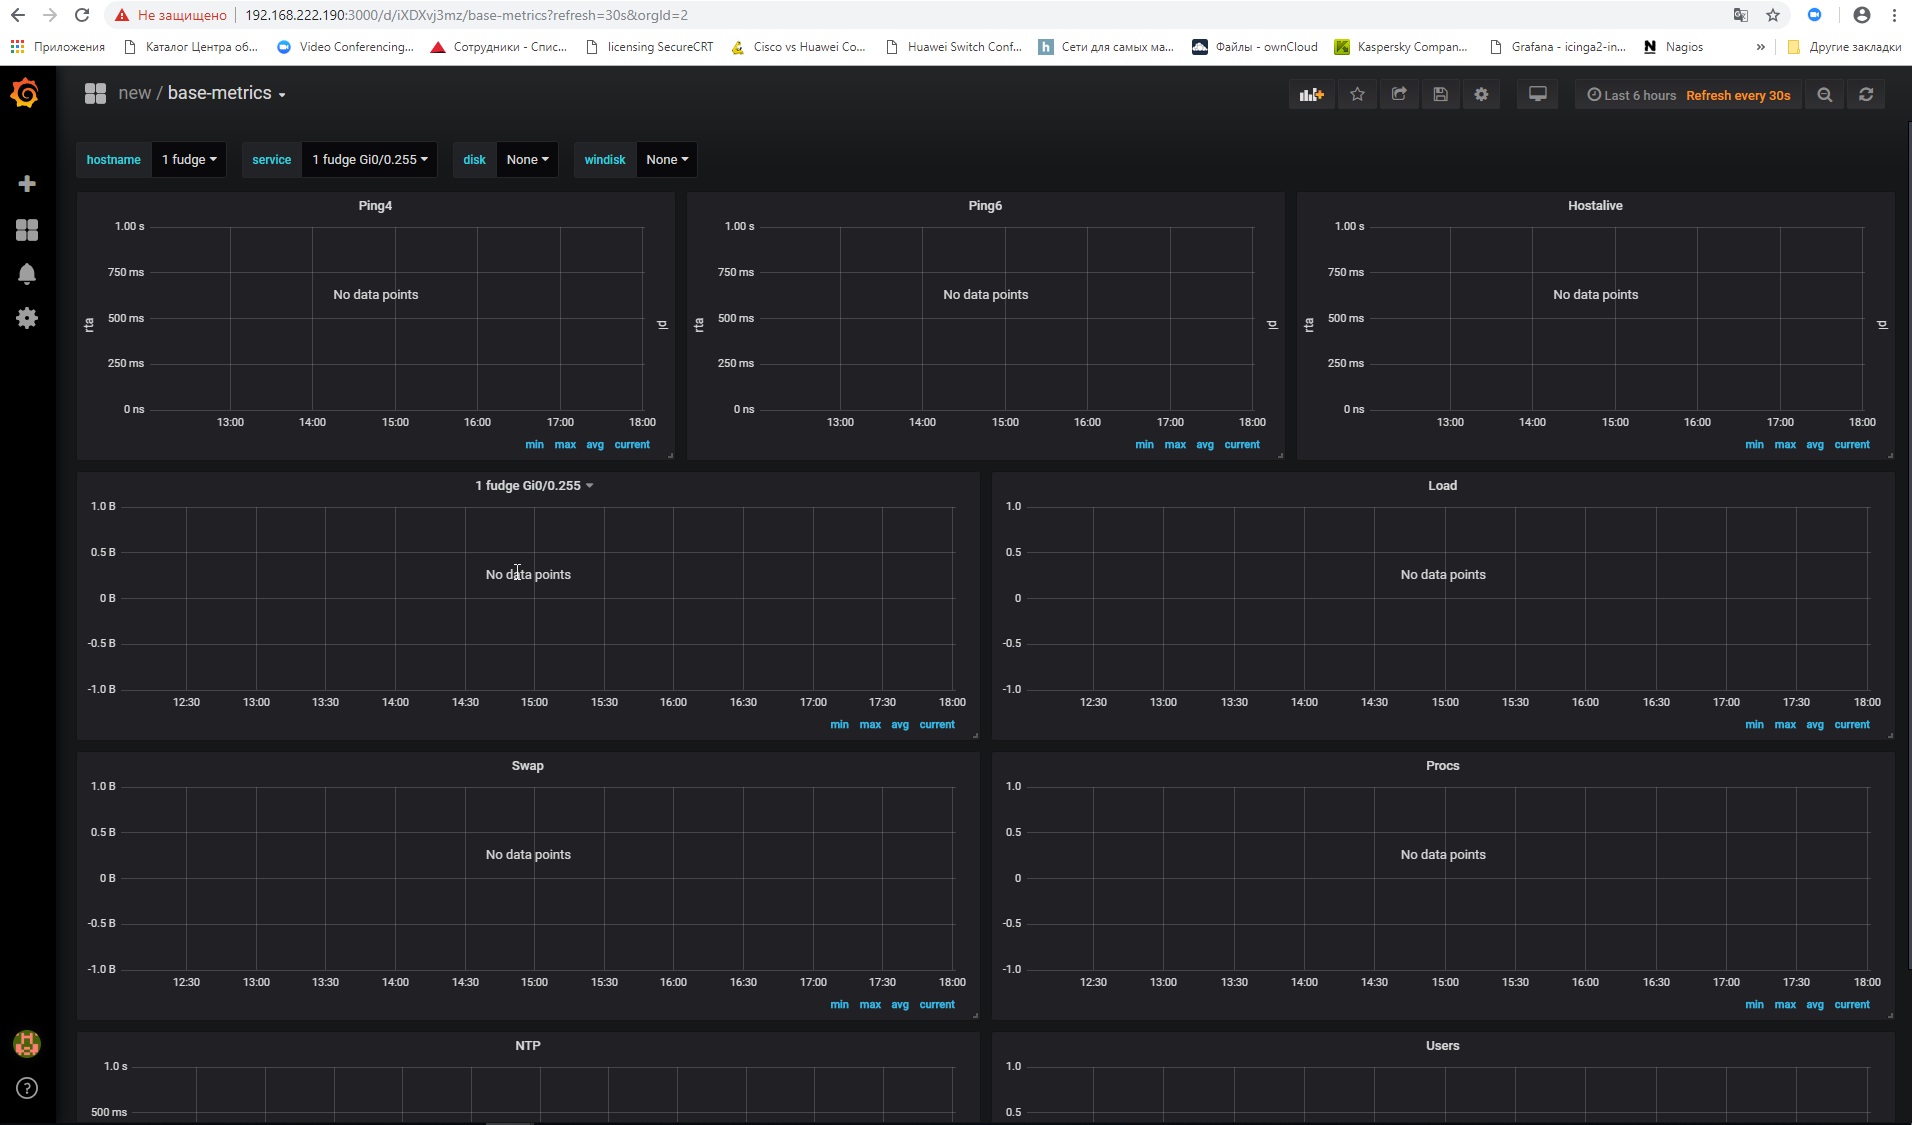
grafana graphics draws.
does not draw isinga.
in 2 new dashboards I haven’t set anything up on the charts
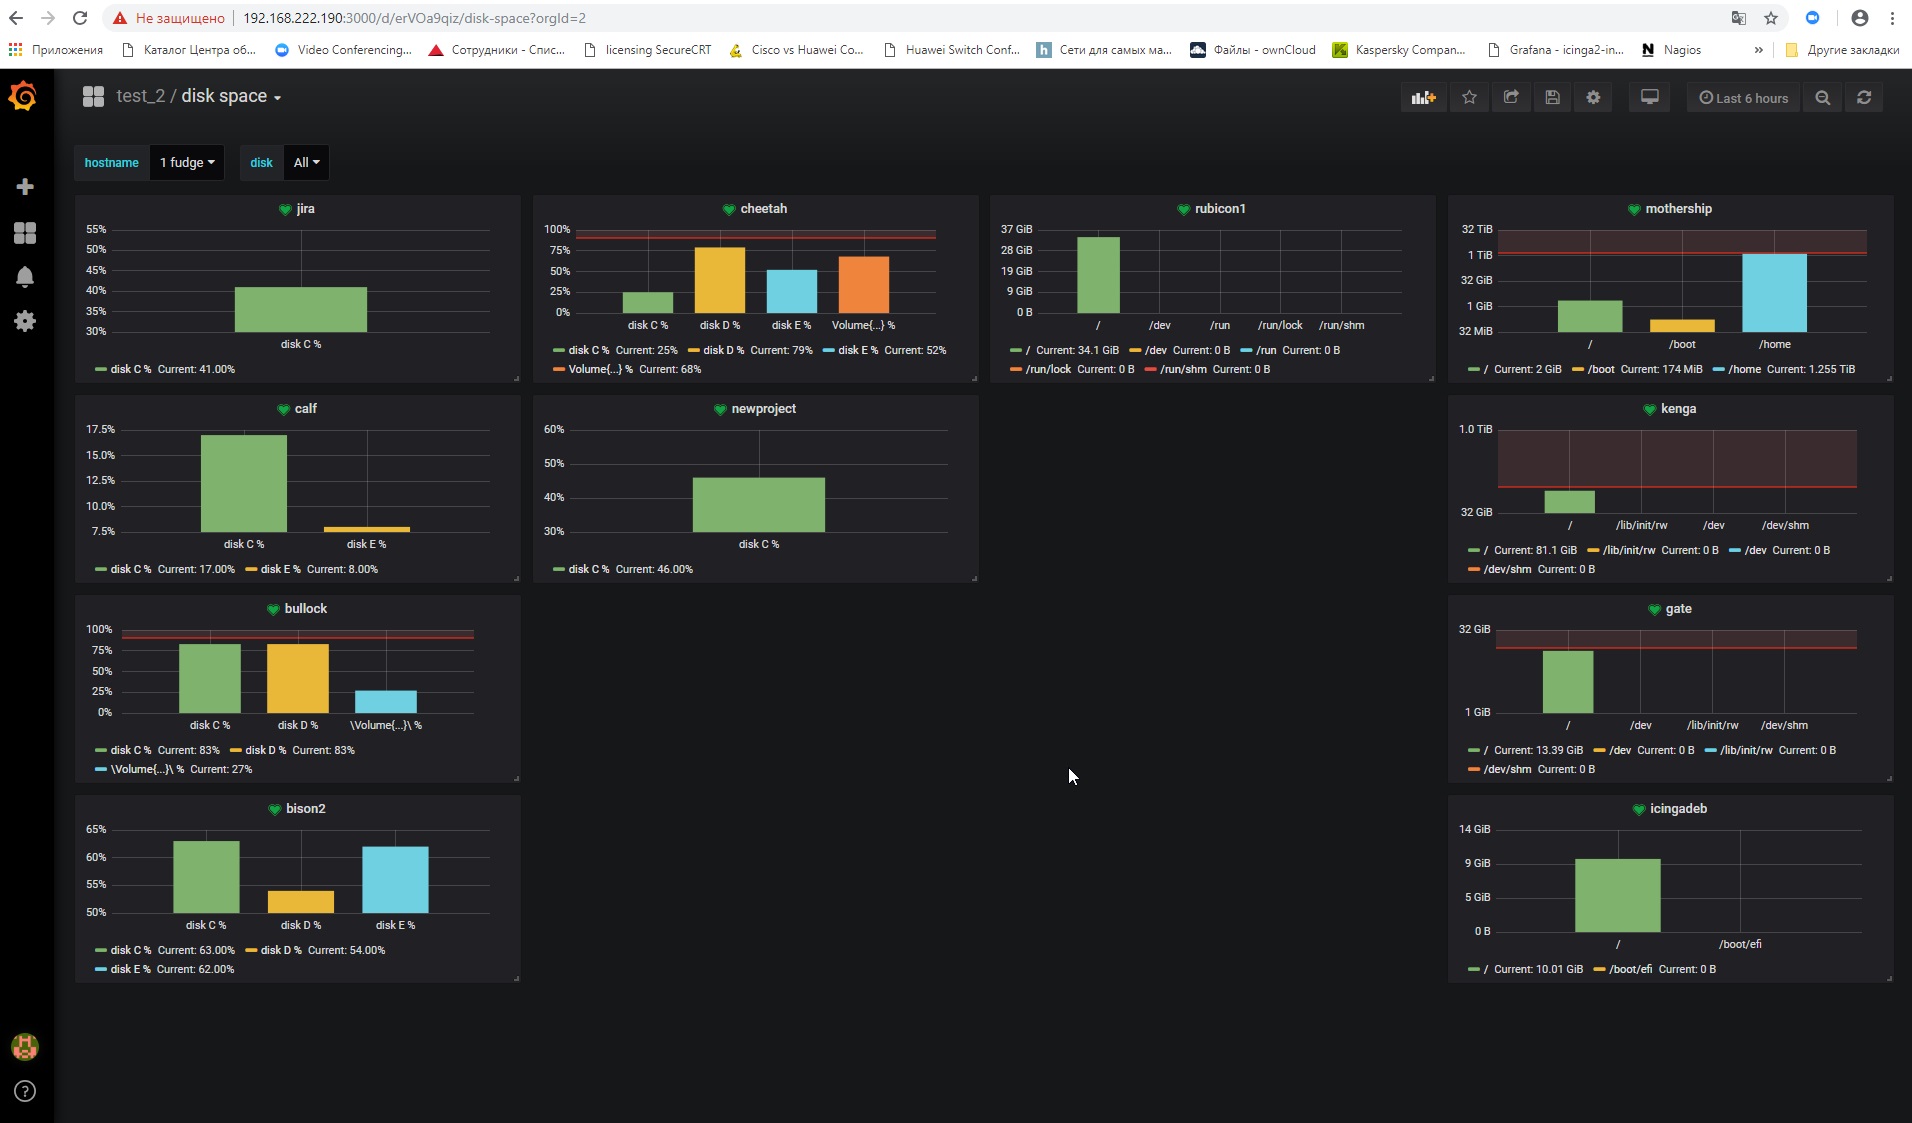
In the dashboards that I did, after removing the organization, all that is needed is displayed.
question directly on the ising itself
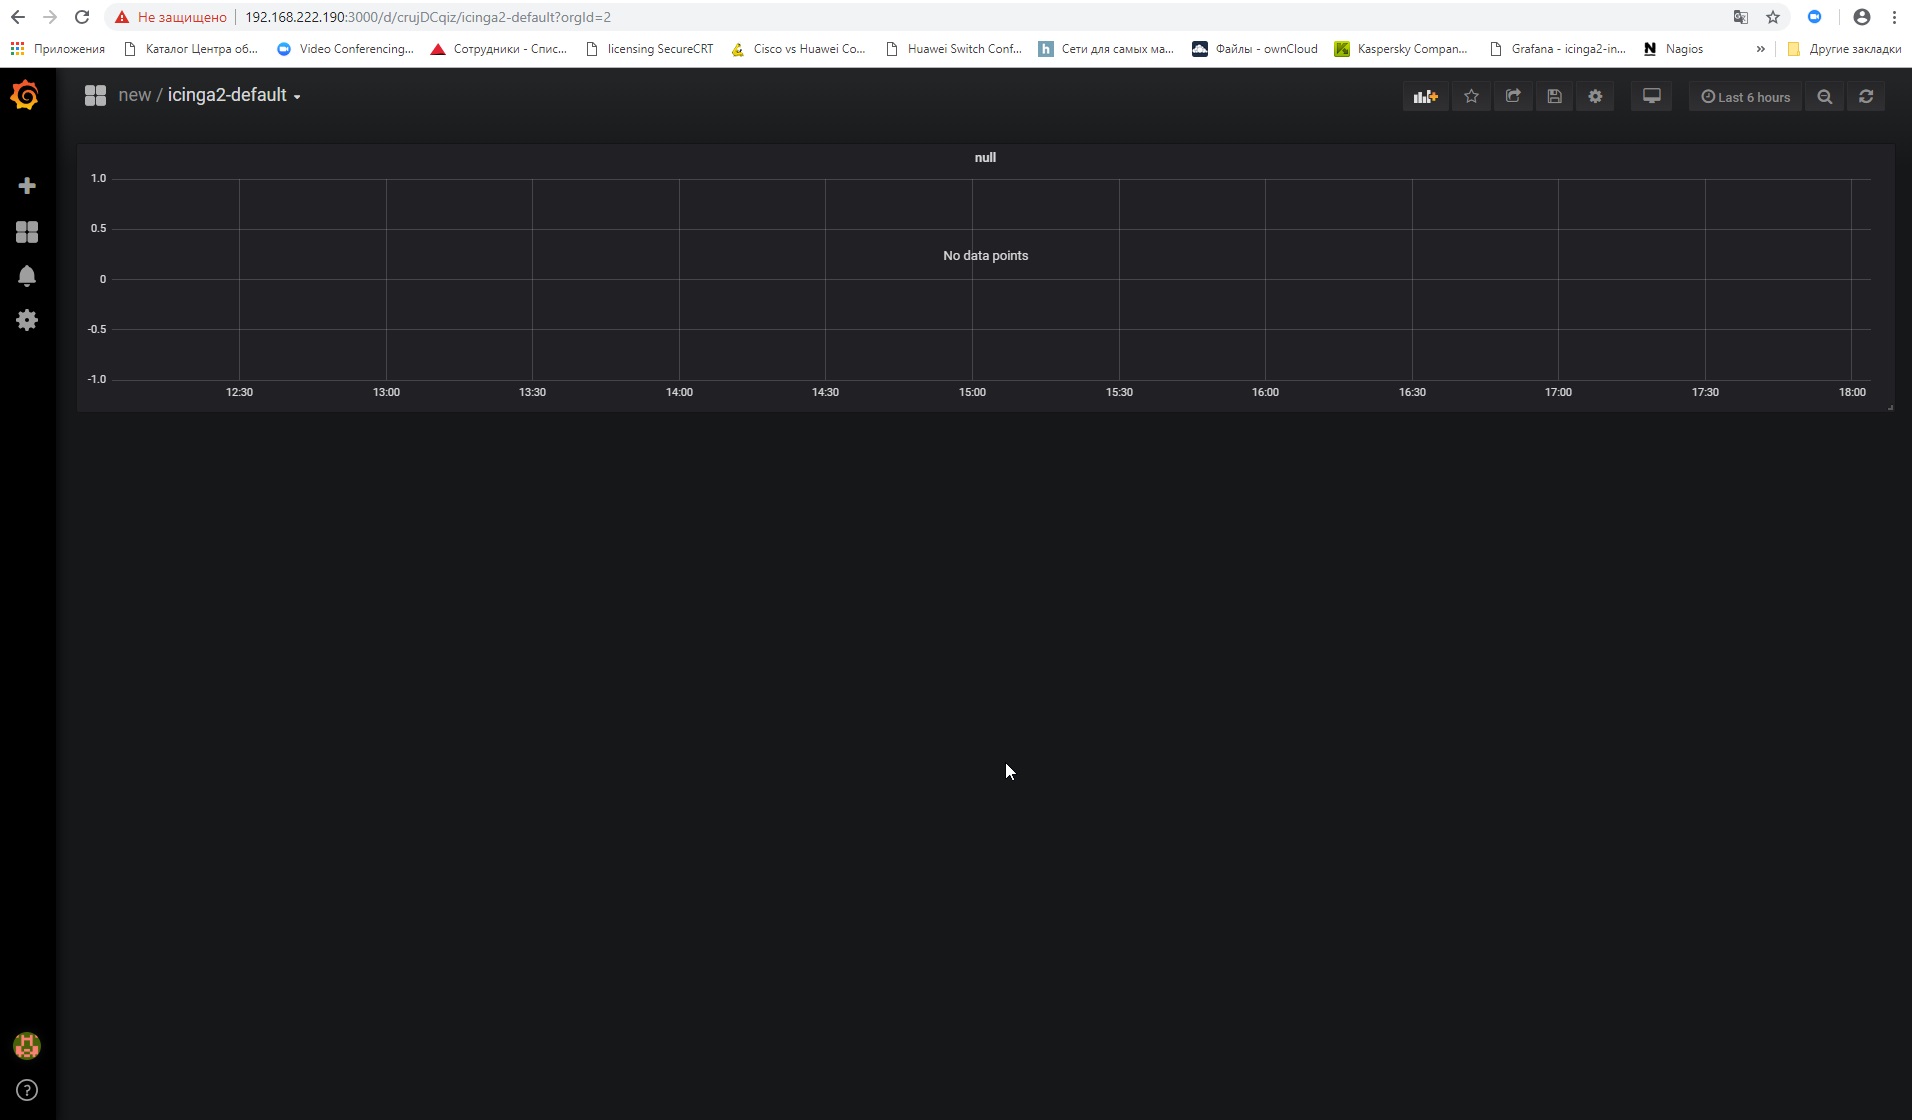
The icinga2-default dashboard works only in the module, because there are only constants and no variables.
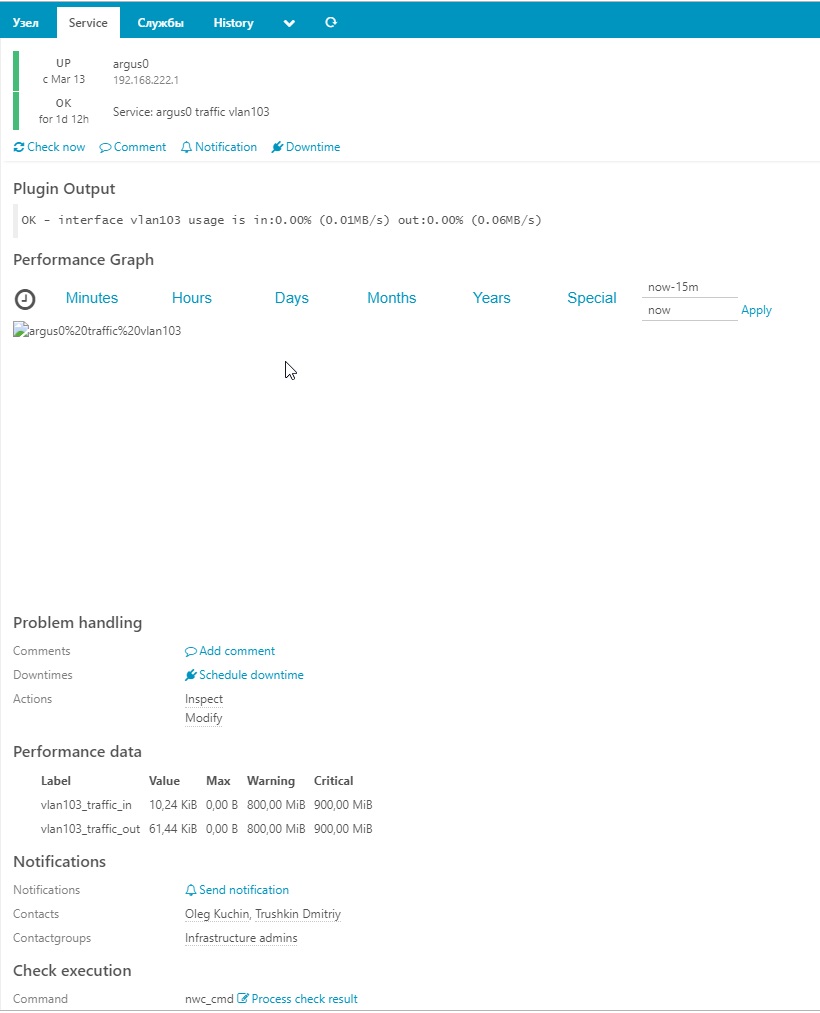
Just click on a service like ping inside icingaweb2 and it should work (but you need to change the default panelid to 1 in the configuration, 30 is WRONG). If you want to see a graph also for hostchecks, you have to add the commandname as a graph configuration inside icingaweb2.
Base metrics only works if you use ITL commands or services named configured inside the panels sql.
1 Like
Please enable debug mode of the module and try to open the link from the debug output in the same browser tab. But i still miss the authentication settings.
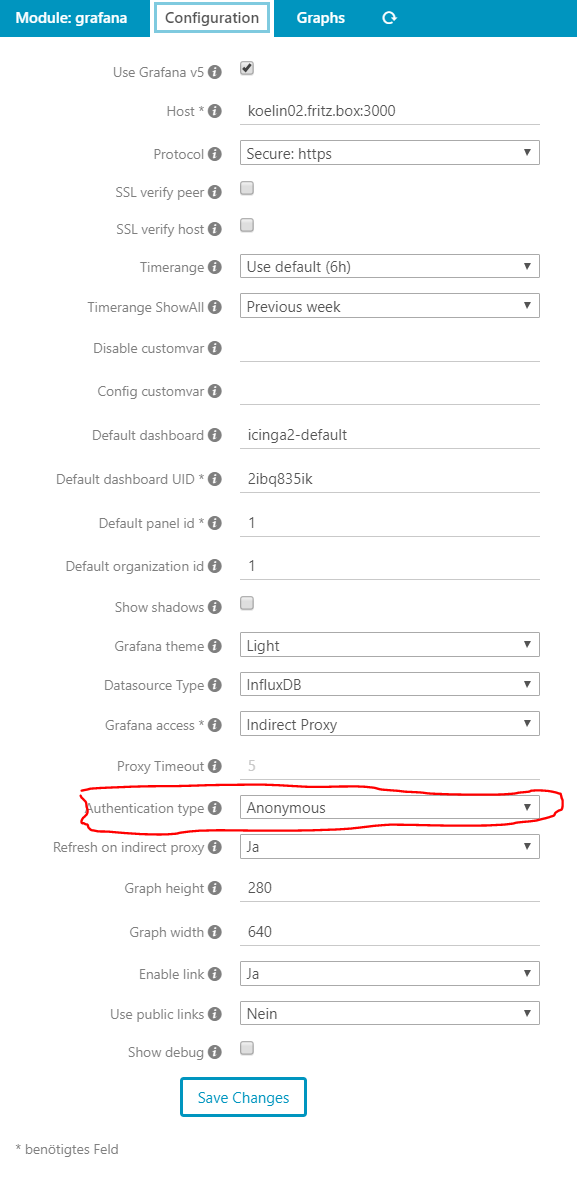
If possible, delete the config.ini of the module and only use web ui to configure the module.
Dont delete the Grafana config. All the module configuration are normaly under /etc/icingaweb2/modules/…
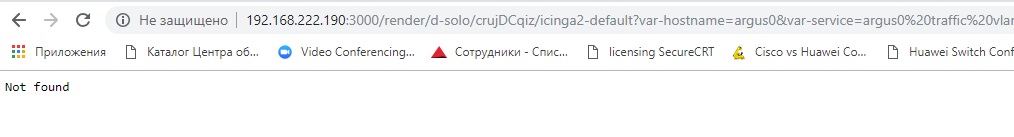
As the link also does not eork, there is something wrong with your Grafana installation.
Hooray!!
I still realized what was required of me)))
path /etc/icingaweb2/modules/grafana
config.zip (379 Bytes)
1 Like
I now have 2 data
sources.
InfluxDB and InfluxDB_lokal
differ only in
the name and presence in one of them of basic authentication.
moreover, as the
default source, select InfluxDB, but when setting up the graphs in the
drop-down menu there is only InfluxDB_lokal
how can this affect
??
Achieved that the graph fields are displayed in the ising.
BUT … they are displayed without data. just empty graphics
Olegus if you want we can do a remote session via skype or something similar. so i can see what is installed and configured.
1 Like
team viewer
1 097 071 007
email me when
ready
thank
invitation sent.
no answer yet
Don’t stress it, this was more than a kind offer by @anon66228339.
Typically you won’t get that on this community platform, remote sessions always cost someone money in terms of private support.
Cheers,
Michael
You should check your direct messages here. I wrote you one. When you send me the teamviewer details i was at a customer.
Gentlemen, I understand
perfectly that the offer is excellent. and I didn’t write to speed things
up or press them down. solely as a test, there I even knocked or not))