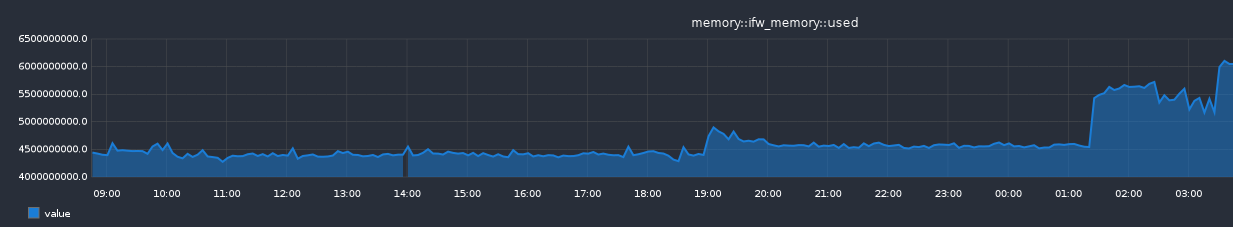
Is there a way to alter the value presentation so for the below example it shows MB used instead of bytes?
Hi,
yes. By defining a specific template. The graph you currently get is generated by using a default template.
Take a look at the disk checks for example, if you have any. Or at the template for it: /usr/share/icingaweb2/modules/graphite/templates/disk.ini
1 Like
From what I can see the temlate getting applied is “multi3-service” on this graph and also on partition space that is using the check command below:
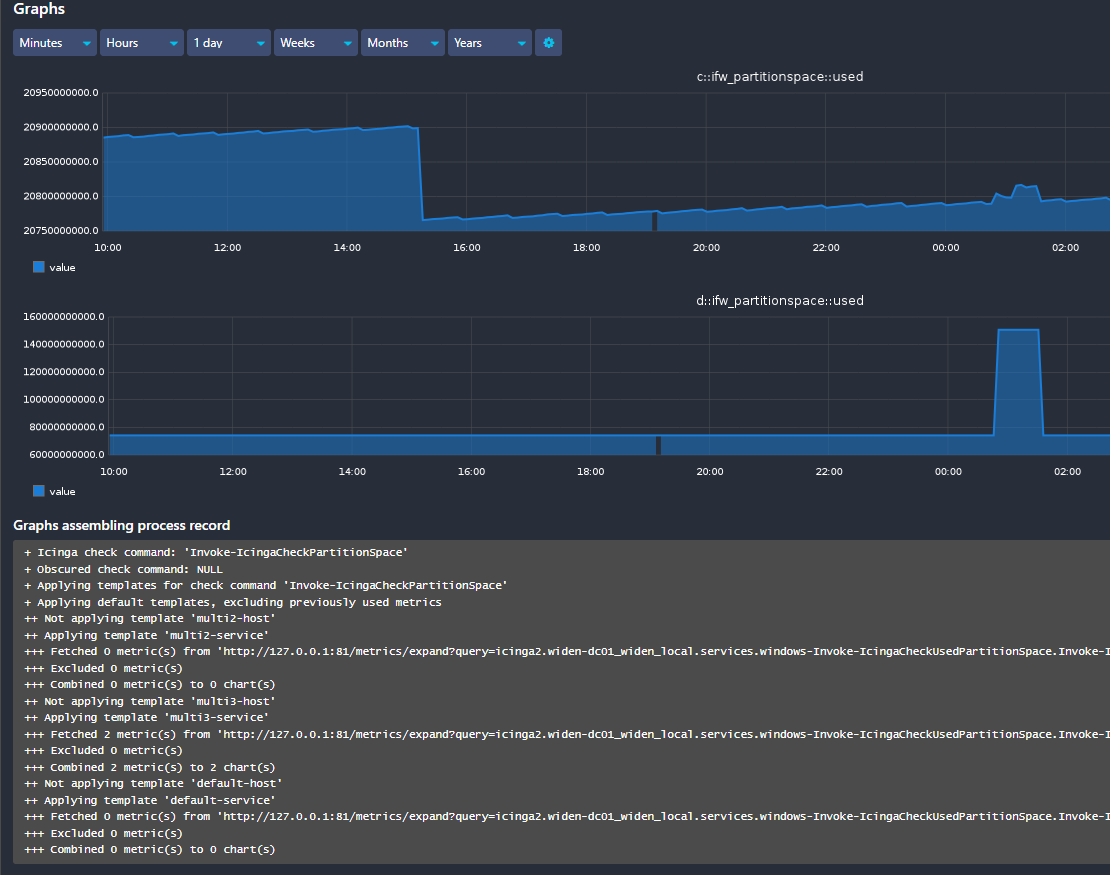
But there is templates for Invoke-IcingaCheckMemory from what I can see… but it doesn’t seem to get applied:

multi3-service is one of the default templates. It doesn’t know anything about the value’s unit. For this you need your own template as mentioned.
Invoke-IcingaCheckMemory is identified using the check command, but no metrics were fetched. It looks for used_bytes and memory_percent_used. Take a look at the service’s performance data and check if those exist. Their names may differ though. Then try adjusting the template.
Sorry for the very late follow up on this… And happy new year to everyone! ![]()
I can’t seem to get the percentage performance data shown in icinga… I see this in PS:

But this in icinga:
Can I look somewhere else for the performance data?
Anyone that has any input on this?
Are you using Icinga DB?
I asked because the performance data seems rather to be out of date in the UI. I suppose you already used the “check now” action, to see if something changes?
This might be a case of non-synchronized data between Icinga 2 and Icinga DB. This manifests usually in other issues as well, though. So, do have any other cases of outdated information? For example, checks that don’t seem to run, or whose state is not what is expected. You might also have duplicate objects.
I understand. What I can see no other problems occur and this problem is the case other windows servers also.
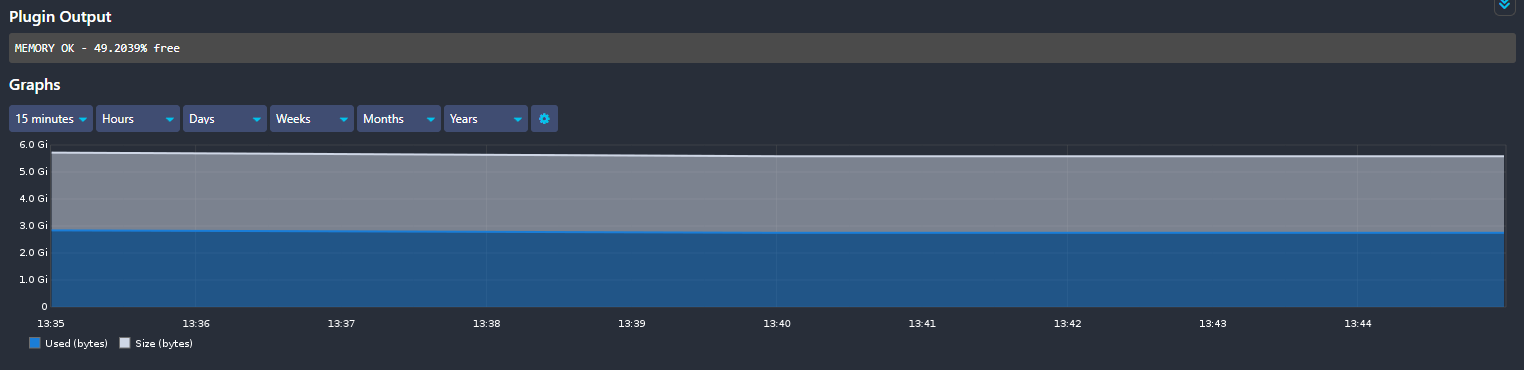
I’ve done some more testing regarding this. The plugin seems to be good and is reporting Used Memory % back.
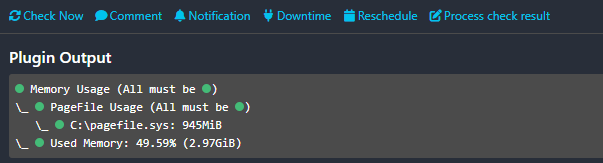
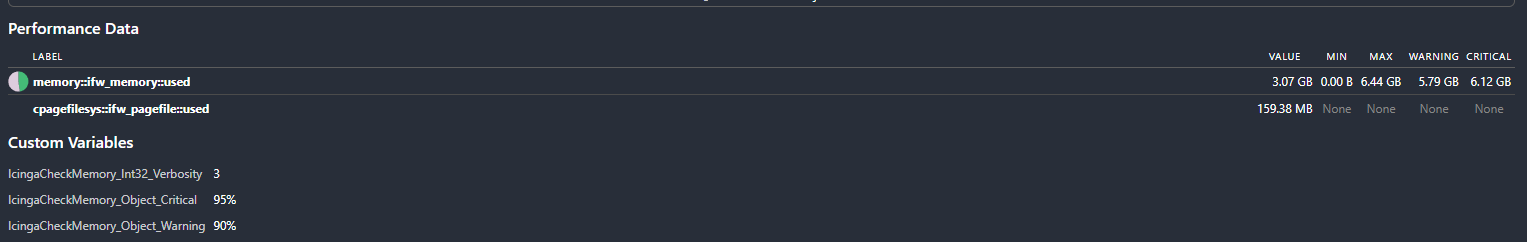
But the performance data doesn’t seem to contain that value as shown here:

If I do a check now… the performance value for GB used is updating so it seems fine, just that it doesn’t show the percentage value.
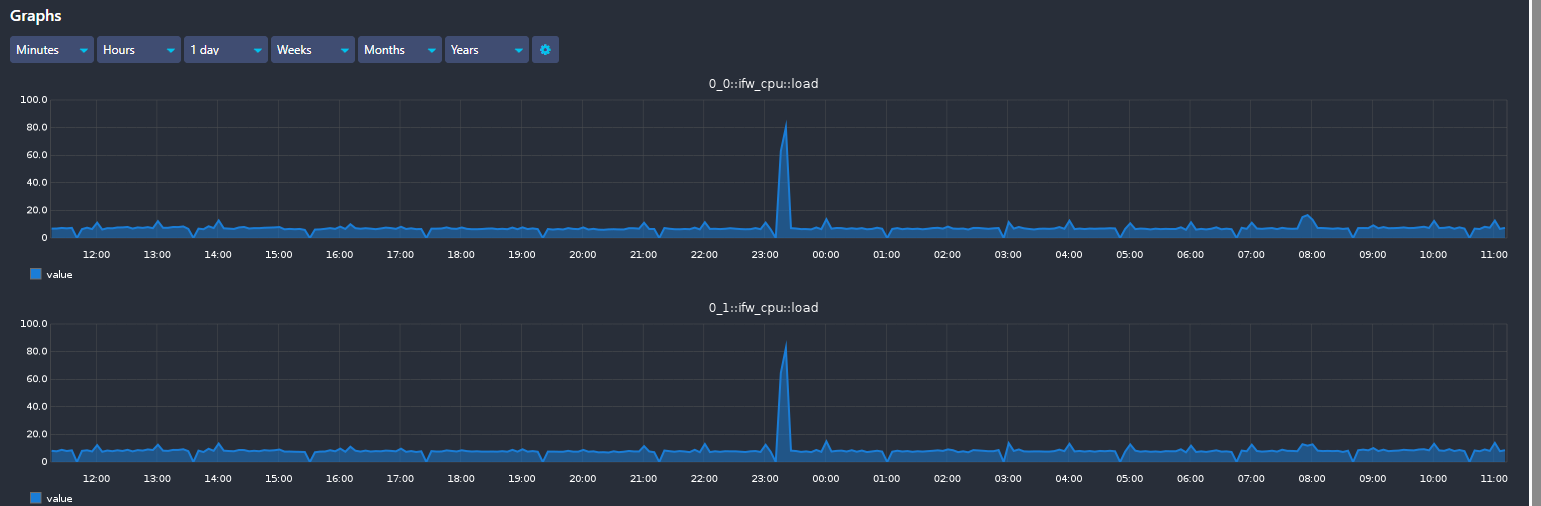
If I compare this with the Invoke-IcingaCheckCPU that shows correctly in graphs:
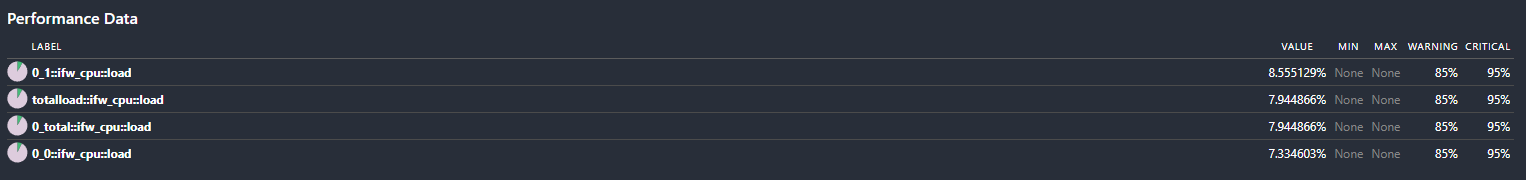
And perfdata:
Is it maybe something missing in the config for which data is sent to the graphite DB for the memory checks?
The last screenshots perfectly match. It’s just that the plugin reports in Mibibyte and Gibibyte and the performance data is shown as Megabyte and Gigabyte.
The reason why you don’t get a pie chart for the pagefile size is because it’s not in percent, but in MB. For the latter a min and max value is required to visualize this as pie chart.
OK thanks. But how can I get the graph to show % usage for memory?
![]()
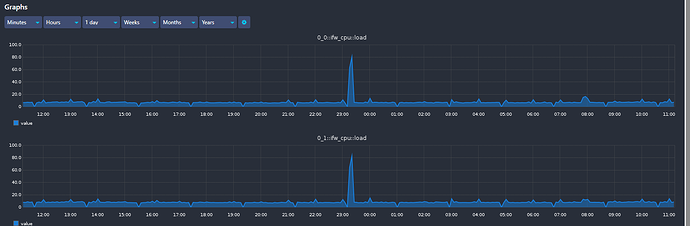
I want that % to be in the Graphite view as the CPU one:
I’ve explained this already above.
I don’t know why the perfdata labels differ in your case. Are using the latest version of the powershell plugins?
Sorry if I’m slow… I’m still new to Icinga…
But I can’t seem to see the perfdata for % used, only memory::ifw_memory::used (in GB) and pagefile (MB) as I shown above.
The PS module version seems to be 1.11.1.
If I run the PS module manually I get:
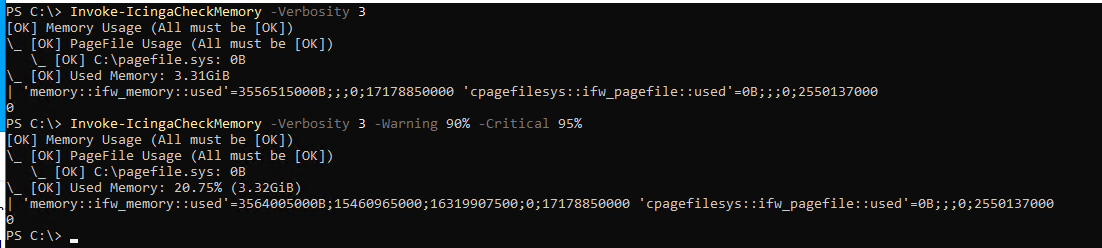
And this is the “inspect” result:
'C:\Windows\System32\WindowsPowerShell\v1.0\powershell.exe' '-NoProfile' '-NoLogo' '-ExecutionPolicy' 'ByPass' '-C' 'try { Use-Icinga -Minimal; } catch { Write-Output '\''The Icinga PowerShell Framework is either not installed on the system or not configured properly. Please check https://icinga.com/docs/windows for further details'\''; Write-Output '\''Error:'\'' $($_.Exception.Message)Components:rn$( Get-Module -ListAvailable '\''icinga-powershell-*'\'' )rn'\''Module-Path:'\''rn$($Env:PSModulePath); exit 3; }; Exit-IcingaExecutePlugin -Command '\''Invoke-IcingaCheckMemory'\'' ' '-Warning' '90%' '-Critical' '95%' '-IncludePageFile' '@()' '-ExcludePageFile' '@()' '-Verbosity' '3'
Maybe I can instead use the memory-windows command… That seems to at least give me a graph that show used memory in correlation with the max and a number of % on top.
And the perfdata:
Still not showing the graph in % but at least gives a easier view.
Okay, I’ve checked where that difference is coming from. The templates of the graphite module are outdated. I’ve already created an issue for this: Templates for the Icinga Powershell Plugins are outdated · Issue #322 · Icinga/icingaweb2-module-graphite · GitHub
The next release of the Icinga Web Graphite Integration will fix this.
1 Like
Great! So I just then need to wait a bit for the next release and update ? ![]() Thanks for looking into this @nilmerg
Thanks for looking into this @nilmerg ![]()
Yeah, at least the few templates which are already there will be fixed. Though, not all checks are covered and this will not change.
If you need support for all types of checks, you should take a look at the grafana integration.