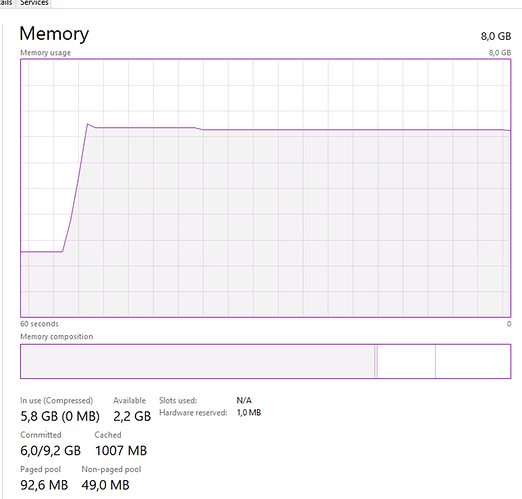
It’s me again… ![]() Just notice some “fun” stuff… If I use the memory-windows check, it seems to be confused on what is “Used memory” and “Free”. See my example below where I have a server with 8 GB memory. I run testlimit on it to simulate ram usage. How should I alter the graph so it’s actually showing the usage and not free ram ?
Just notice some “fun” stuff… If I use the memory-windows check, it seems to be confused on what is “Used memory” and “Free”. See my example below where I have a server with 8 GB memory. I run testlimit on it to simulate ram usage. How should I alter the graph so it’s actually showing the usage and not free ram ?
With 4 GB added usage:
Win Perfmon:
Plugin: OK result

Perfdata: Shows free memory as value. OK.
Graphite graph: Show the other way around, usage is less? Reflects perfdata value for free memory left, not usage.

