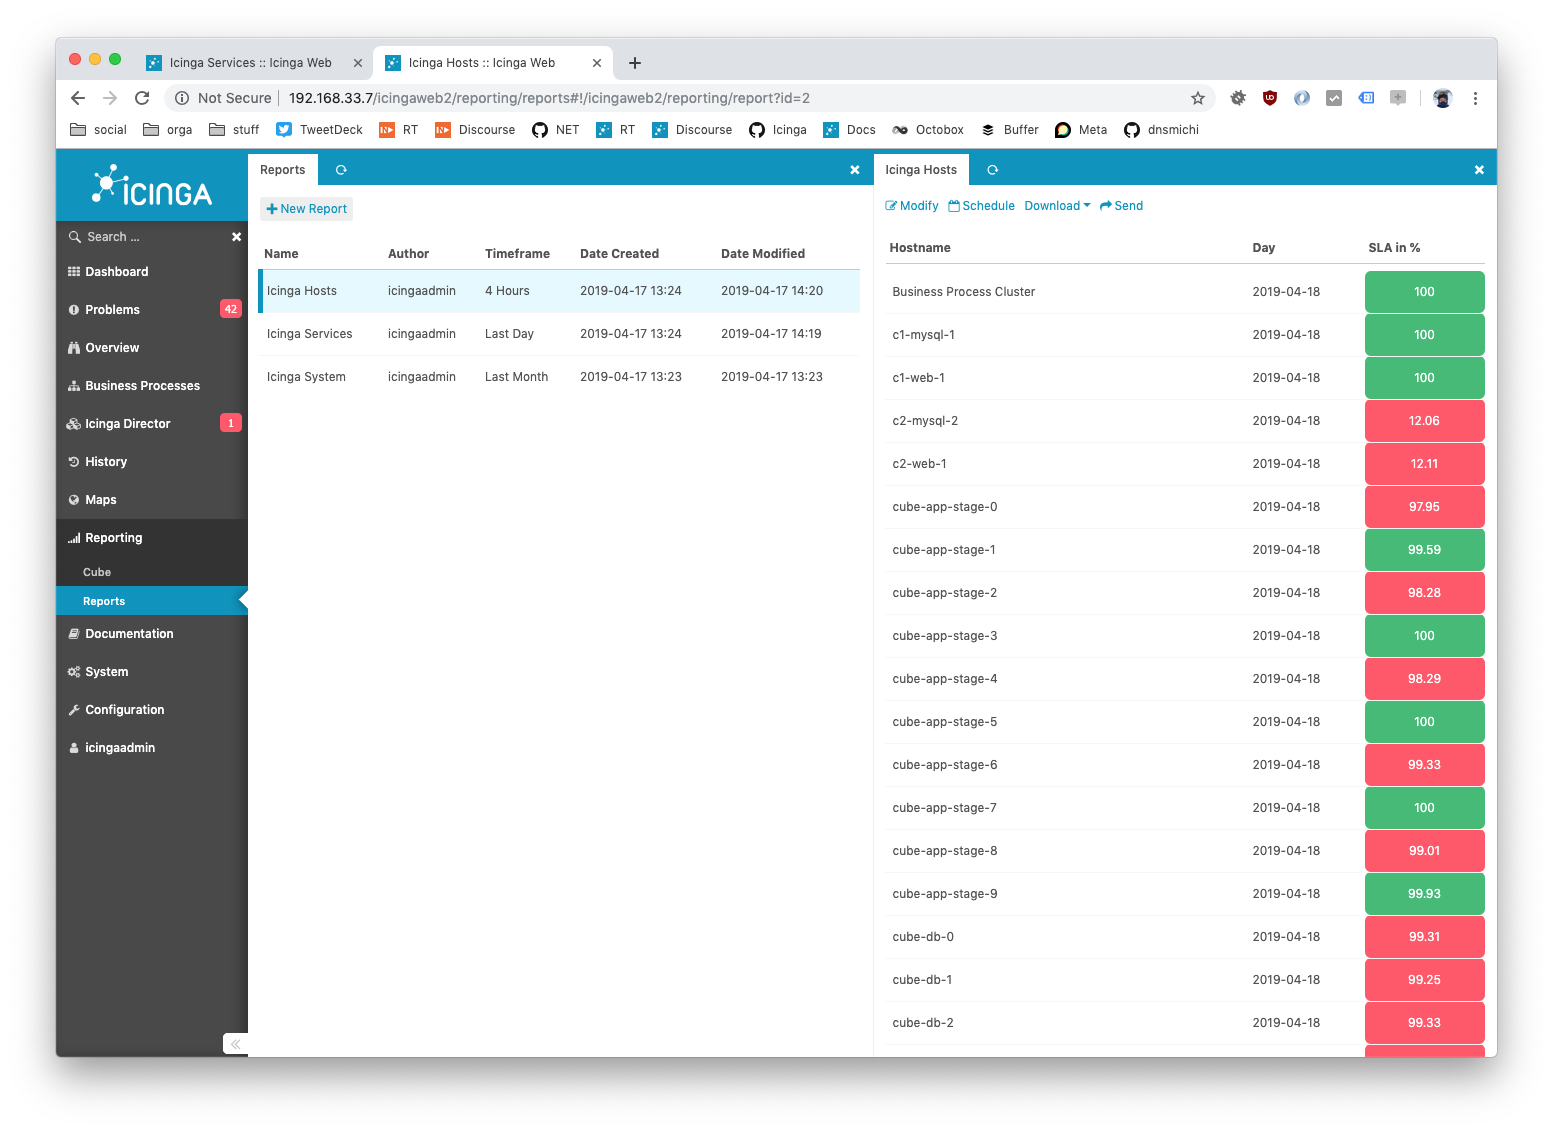
Icinga Reporting
Icinga Reporting is the main framework where other modules can provide data sources and reports. The first module is idoreports adding reporting capabilities from the IDO database backend.
Follow the documentation and ensure that all requirements are fulfilled.
This product is currently under development. Please follow the GitHub issues and milestones for updates.
First early adopter release v0.9.0: https://icinga.com/2019/04/17/releasing-icinga-reporting-for-early-adopters/
Demo
Available inside the Vagrant boxes: GitHub - Icinga/icinga-vagrant: Vagrant boxes for Icinga 2, Icinga Web 2, modules, themes and integrations (Graphite, InfluxDB, Elastic, Graylog, etc.) · GitHub
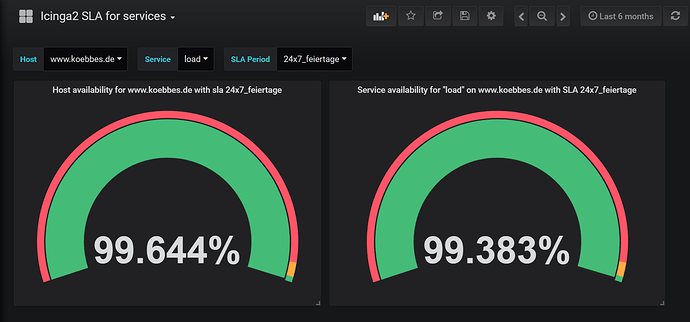
Grafana
Grafana allows you to define not only Graphite, InfluxDB as datasource but also Elasticsearch and MySQL even. This way you can also use an Icinga database with SQL queries against the statehistory, downtimehistory and notifications tables.
Resources:
Jasper Reports
This tool allows you to build reports based on different datasources. You can use existing modules which come with pre-defined templates (the old Icinga reports module for example) or write your own query templates and visualization reports.
Resources:
