Hi, I’m trying to determine if my icinga2 satellites are overloaded or not with current checkload.
As per documentation, there is an ITL checkcommand named “icinga” that helps measure the performance of an icinga instance. As “descriptives” as names are on the performance data; I’m having a hard time undertstanding if my Icinga instance needs more hardware or not.
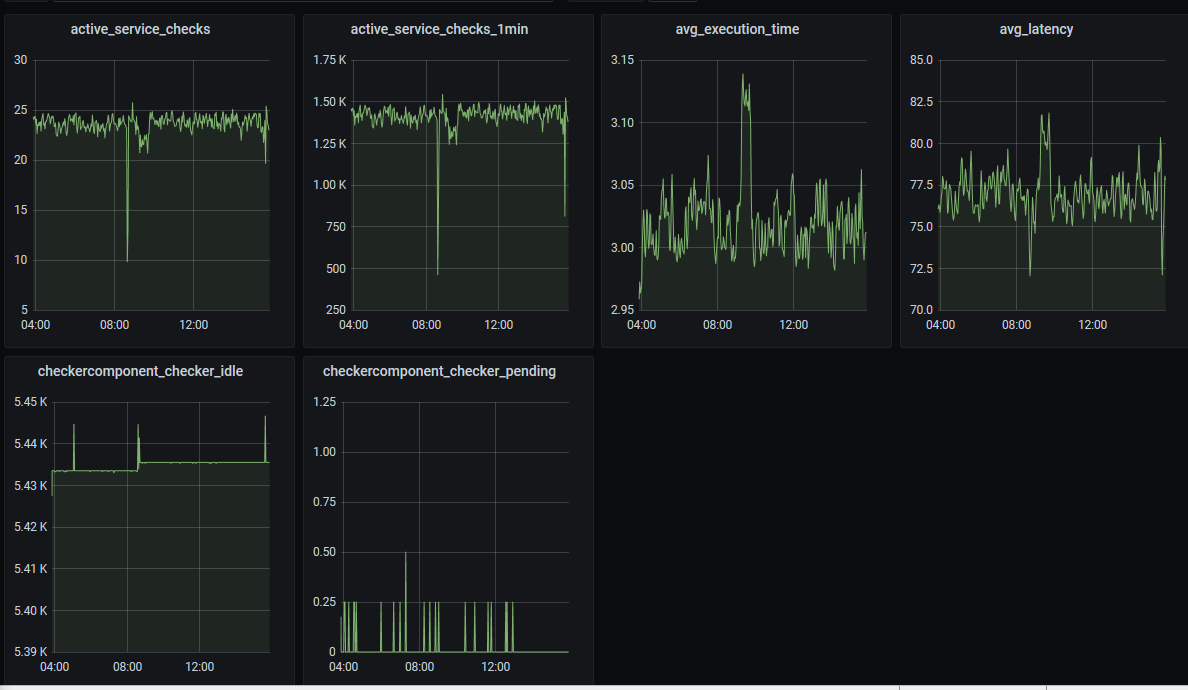
what the measurement units are for avg_execution_time and avg_latency ?
what does checkercomponent_checker_idle means ? and what units are being represented?
What does checkercomponent_checker_pending measures, and what units are being used? < as per code it waits half a second when you have more checks than MaxConcurrentChecks running>
what is the difference betweeen avg_execution_time (is that seconds? mintues?) and avg_latency (seconds ??). how do they correlate?, what times are being measured ? (it would be nice to have a timeline explaining start/end of each on them and their correlation)
how can I tell if the checker component is under heavy load or not?
avg_execution_time is in seconds and I think avg_latency is milliseconds.
2-3 ?
exec time is literally how long tests take on average. Most checks are Perl/Python/whatever scripts and have to do quite a bit of work. An interpreter instance is fired up and the script passed to it, it does work at a distance, the other end may do some processing which may need another interpreter and then reports back. Three seconds is fine for all that stuff
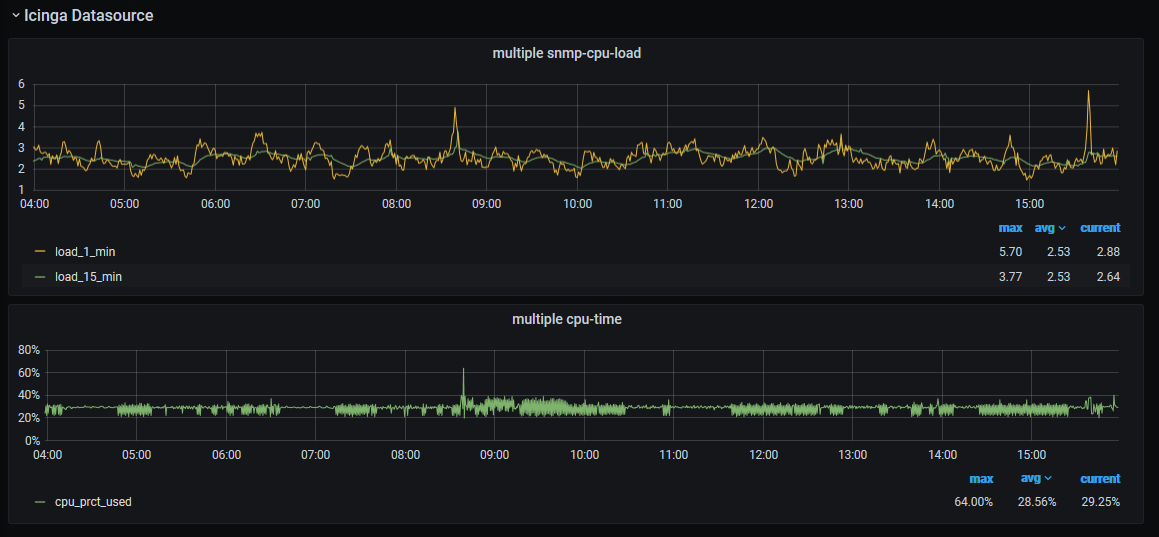
Your multiple snmp-cpu-load is reporting 1 and 15 min load averages and these hover at 3 in general. That number needs to ideally be less than the number of cores available to the monitoring system. I’m going to guess it has four or more.
CPU time is around 30%. That’s fine.
The key things to watch on a Linux box are CPU%, load averages and “I/O wait” and RAM but lack of that will generally show itself in the other metrics. Run top and watch it for a while. Most of the stats are reasonably obvious but disk I/O wait is the number next to wa in the %CPU line. If that is constantly >0 then you may have a disc I/O problem. top is normally available out of the box but atop (advanced top) is a bit nifty because it will colour code potential problems for you. There is also htop generally available.
It looks like you are running about 150,000 active checks per minute or 2,500 per second.
Overall I’d say all is well there. However to go deeper I need to know what rough specs you have - load averages only make sense when you know how many CPUs are in the box. Is this a VM? hyper threading enabled on the host? RAM?
Hi John, Thanks for your prompt reply. I have ommited box specs on purpose, but I’m running 8cores, 12G ram, Virtualised linux boxes ( CentOS 7.9.2009 ). Two Icinga satellites running HA Zones (icinga 2.11.6-1).
So just to confirm my understanding:
exec_time is how long it takes Icinga to queue the check command process (seconds);
latency_time, how long it takes the process to complete (seconds);
so any of my 24 checks/second, on average take 3 + 77 seconds to complete. Is that the correct interpretation of the command outcome?
Any Idea on the checkecomponent stats meaning and units?
Will look into IO stats, as memory seems to be quite oversized as compared to process utilization footprint.
Icinga 2 stores the scheduled start and end time for a check. If the actual check execution time differs from the scheduled time, e.g. due to performance problems or limited execution slots (concurrent checks), this value is stored and computed from inside the check result.
The difference between the two deltas is called check latency.
Is it safe to assume that checkercomponent_checker_idle is the count of checkables that can be scheduled? github code
Cant make out if code defines the checker_pending as a 0.5 seconds lock wait or a count of checkables result has not been received… would need some advise…
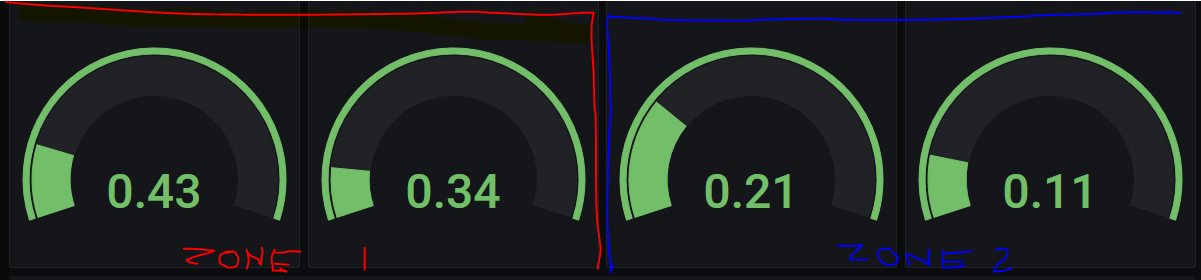
I have captured the checkercomponent_checker_pending average over the last 3 days on 4 satellites, left pair is one zone, right pair is another zone. Can anyone tell/explain what that value means?