Icinga2 at large scale

Hello community,
I was not sure where to put this topic, please move it if it’s under wrong category

In this topic i would like to cover several questions: system requirements, possible bottlenecks and benchmarking. Hope this will simplify installation for new users and provide “ready for deploy” cluster schemas and strategy.

My main goals are:

  1. define benchmarking tools for stress testing of cluster prototype
  2. define how scalable Icinga2 is, based on stress tests
  3. provide system requirements for the server hardware

A little bit of background
Currently i’m working under Proof of Concept of Icinga2 for my company production environment.
It will be couple of Icinga2 distributed clusters of different size, the biggest one should handle up to 30k clients.
I’ll need to make several standardized clusters, for example:
Cluster S: up to 500 clients
Cluster M: up to 5000 clients
Cluster L: up to 10000 clients
Cluster XL: up to 30000 clients

Preferred environment:

  1. “master” & “satellite” components will be cloud based systems with instances with 8 CPUs / 16 GB RAM.
  2. MySQL cluster on cloud instances with 8 CPUs / 16 GB RAM with floating IP.

Optional environment for biggest clusters:

  1. “master” components on baremetal servers, “satellites” on cloud instances with 8 CPUs / 16 GB RAM.
  2. MySQL cluster on baremetal servers with floating IP

Possible bottlenecks:
Following documentation of top-down 3 level clusters, main bottleneck could be a Icinga2 master zone as it’s horizontal scale limit is 2 nodes in HA mode (please correct me if i’m wrong).

First of all i need benchmarking tool to emulate 30k of real clients, this will allow me to understand if it fit our needs for the largest cluster.
Test requirements: 50 checks, 1 minute frequency for each check, 30000 emulated clients.
Summary for system would be to handle: 1.5 million events per min or 25000 events per second.

Does anyone have experience with standardization and benchmarking of Icinga2?

I would like to generate real load with active checks, it could be done with docker instances but i’m looking for a more elegant way, because docker will make a big resource overhead. Please share with what tools you generated load for a tests.

With best regards,
Dmitriy.

3 Likes

I’ve been testing Icinga2 in different cases and it’s time to share with first results.

Initial goal was to test main potential architectural bottlenecks - Icinga Masters & MySQL cluster
For testing i decided to generate load with native Icinga2 virtual Host objects on Agent Endpoints
Each virtual Host object contains:

  • 50 dummy service checks with 1min frequency
  • 1 random service check with 5min frequency
  • 1 dummy host check with 5min frequency
    Each Agent Endpoint have 1000 Host objects configured on it.

Icinga2 version in all tests: 2.11.2-1

All checks executed from Agent Endpoints and sends data to Satellite hosts, in this case its hard to see real workload from Satellite standpoint because each Agent endpoint emulates 1000 hosts, but sends all data through single TCP connection, for us it’s not critical because Satellite Zones are easy at horizontal scale.

First test in my cloud environment, followed Distributed setup strategy from Icinga2 documentation:
1 MySQL Database instance: CPU: x8(CPU MHz: 2394) RAM: 16GB
2 Masters in HA, CPU: x8(CPU MHz: 2394) RAM: 16GB
6 Satellites in HA (3 Satellite Zones), CPU: x8(CPU MHz: 2394) RAM: 16GB
6 Icinga2 Agents, 2 agents per each Satellite Zone, CPU: x4(CPU MHz: 2394) RAM: 4GB

With this configuration i was able to get only 2500 Hosts working, ~2000 events per second.
Workload on Masters was: Load Avarage: 4, RAM used: 4GB
Database also showed 1LA on system, 0% iowait and enough RAM.
When i tried to increase amount of Hosts to 3000-4000, on Masters i saw growing IDO message queues, it reached system memory limits, then process got killed by OOM killer. I’m not a strong DBA so i decided to make DB tuning at the first time, and improve our cluster config with more power of baremetal MySQL instance.

Second test with baremetal MySQL, followed Distributed setup strategy from Icinga2 documentation:
1 MySQL Database instance: CPU: 24 cores, Intel® Xeon® CPU E5-2630L v2 @ 2.40GHz, RAM: 64GB, RAID controller: Symbios Logic MegaRAID SAS 2208
2 Masters in HA, CPU: x8(CPU MHz: 2394) RAM: 16GB
6 Satellites in HA (3 Satellite Zones), CPU: x8(CPU MHz: 2394) RAM: 16GB
6 Icinga2 Agents, 2 agents per each Satellite Zone, CPU: x4(CPU MHz: 2394) RAM: 4GB

Showed the same results, not more than 2500 Hosts, ~2000 events per second. It was confusing so i started to look at Icinga2 performance tuning, options like MaxConcurrentChecks, or uncommenting options in systemd config like TasksMax=infinity,LimitNPROC=62883 didn’t make any effect.

Third test i made distributed configuration in other way, but with same hardware spec:
I started active search on how i can reconfigure/optimize cluster and found few interesting topics in official documentation: https://icinga.com/docs/icinga2/latest/doc/09-object-types/#idomysqlconnection
IDO feature allow to put instance_name option in config, it allow multiple icinga2 clusters to write in a single DB, i’ve got an idea to configure IDO on satellite side.
Instance name should be the same for both satellite endpoints in same HA zone and uniq per satellite zone.

Data flow schema, red lines - check result messages send through Icinga2 Data Exchange on port 5665,
blue lines - processed check result messages sent through IDO DB

Works perfect with director, makes some offload from Master and i was able to keep all cluster alive at around 3000 Hosts, as a final step i configured 6000 Hosts(5000 events p/sec), Icinga2 app on Masters continue leaks with memory and still getting killed with OOM killer, but cluster continue working until satellites sends data in MySQL

On Masters I disabled all icinga2 features and left only “api command mainlog” but it doesn’t help, in logs i can see messages like:

[2019-11-29 02:55:00 -0700] information/WorkQueue: #6 (ApiListener, RelayQueue) items: 1, rate: 5216.35/s (312981/min 312981/5min 312981/15min);
[2019-11-29 02:55:10 -0700] information/WorkQueue: #6 (ApiListener, RelayQueue) items: 80304, rate: 7876.15/s (472569/min 472569/5min 472569/15min); empty in 9 seconds
[2019-11-29 02:55:20 -0700] information/WorkQueue: #6 (ApiListener, RelayQueue) items: 179869, rate: 10479.8/s (628785/min 628785/5min 628785/15min); empty in 18 seconds
[2019-11-29 02:55:30 -0700] information/WorkQueue: #6 (ApiListener, RelayQueue) items: 283860, rate: 13006.9/s (780414/min 780414/5min 780414/15min); empty in 27 seconds
[2019-11-29 02:55:40 -0700] information/WorkQueue: #6 (ApiListener, RelayQueue) items: 399336, rate: 15455.5/s (927329/min 927329/5min 927329/15min); empty in 34 seconds
[2019-11-29 02:55:50 -0700] information/WorkQueue: #6 (ApiListener, RelayQueue) items: 518236, rate: 13332.3/s (799938/min 1071679/5min 1071679/15min); empty in 43 seconds
[2019-11-29 02:56:00 -0700] information/WorkQueue: #6 (ApiListener, RelayQueue) items: 637251, rate: 14938.8/s (896329/min 1211154/5min 1211154/15min); empty in 53 seconds
[2019-11-29 02:56:10 -0700] information/WorkQueue: #6 (ApiListener, RelayQueue) items: 756500, rate: 14645.1/s (878709/min 1354390/5min 1354390/15min); empty in 1 minute and 3 seconds
[2019-11-29 02:56:20 -0700] information/WorkQueue: #6 (ApiListener, RelayQueue) items: 879603, rate: 14372.7/s (862363/min 1493768/5min 1493768/15min); empty in 1 minute and 11 seconds
[2019-11-29 02:56:30 -0700] information/WorkQueue: #6 (ApiListener, RelayQueue) items: 1014816, rate: 13901.6/s (834096/min 1616707/5min 1616707/15min); empty in 1 minute and 15 seconds
[2019-11-29 02:56:40 -0700] information/WorkQueue: #6 (ApiListener, RelayQueue) items: 1140154, rate: 13726/s (823560/min 1753195/5min 1753195/15min); empty in 1 minute and 30 seconds
[2019-11-29 02:56:50 -0700] information/WorkQueue: #6 (ApiListener, RelayQueue) items: 1262784, rate: 13699.8/s (821989/min 1895614/5min 1895614/15min); empty in 1 minute and 42 seconds
[2019-11-29 02:57:00 -0700] information/WorkQueue: #6 (ApiListener, RelayQueue) items: 1383192, rate: 13746.4/s (824783/min 2038166/5min 2038166/15min); empty in 1 minute and 54 seconds
[2019-11-29 02:57:10 -0700] information/WorkQueue: #6 (ApiListener, RelayQueue) items: 1499154, rate: 13778.1/s (826688/min 2183558/5min 2183558/15min); empty in 2 minutes and 9 seconds
[2019-11-29 02:57:20 -0700] information/WorkQueue: #6 (ApiListener, RelayQueue) items: 1615627, rate: 13874.6/s (832476/min 2328664/5min 2328664/15min); empty in 2 minutes and 18 seconds
[2019-11-29 02:57:30 -0700] information/WorkQueue: #6 (ApiListener, RelayQueue) items: 1732766, rate: 14126.9/s (847616/min 2466894/5min 2466894/15min); empty in 2 minutes and 27 seconds
[2019-11-29 02:57:40 -0700] information/WorkQueue: #6 (ApiListener, RelayQueue) items: 1856457, rate: 14151.9/s (849114/min 2604760/5min 2604760/15min); empty in 2 minutes and 30 seconds
[2019-11-29 02:57:50 -0700] information/WorkQueue: #6 (ApiListener, RelayQueue) items: 1975574, rate: 14228.4/s (853703/min 2751306/5min 2751306/15min); empty in 2 minutes and 45 seconds
[2019-11-29 02:58:00 -0700] information/WorkQueue: #6 (ApiListener, RelayQueue) items: 2094517, rate: 14195.5/s (851733/min 2892344/5min 2892344/15min); empty in 2 minutes and 56 seconds
[2019-11-29 02:58:10 -0700] information/WorkQueue: #6 (ApiListener, RelayQueue) items: 2212559, rate: 14104.3/s (846259/min 3032364/5min 3032364/15min); empty in 3 minutes and 7 seconds
[2019-11-29 02:58:20 -0700] information/WorkQueue: #6 (ApiListener, RelayQueue) items: 2342521, rate: 13928.9/s (835732/min 3166993/5min 3166993/15min); empty in 3 minutes
[2019-11-29 02:58:30 -0700] information/WorkQueue: #6 (ApiListener, RelayQueue) items: 2461257, rate: 13863.3/s (831796/min 3300993/5min 3300993/15min); empty in 3 minutes and 27 seconds
[2019-11-29 02:58:40 -0700] information/WorkQueue: #6 (ApiListener, RelayQueue) items: 2583046, rate: 13924.9/s (835495/min 3443022/5min 3443022/15min); empty in 3 minutes and 32 seconds
[2019-11-29 02:58:50 -0700] information/WorkQueue: #6 (ApiListener, RelayQueue) items: 2700537, rate: 13973/s (838377/min 3592124/5min 3592124/15min); empty in 3 minutes and 49 seconds
[2019-11-29 02:59:00 -0700] information/WorkQueue: #6 (ApiListener, RelayQueue) items: 2815752, rate: 14053.7/s (843222/min 3737734/5min 3737734/15min); empty in 4 minutes and 4 seconds

Seems like Icinga2 instance accepts messages faster than it able to drop them

Now i’m looking at way to disable sending check results messages to Master from Satellites, it will allow Master to be offloaded and be responsible only for API calls and Configuration distribution

@dnsmichi do you have any thoughts how to disable it?

8 Likes

Impressive analysis, thanks.

Unfortunately you cannot disable cluster synchronization for specific message types, this is built-in and required for keeping the state in sync. Also, the third scenario is something we generally don’t recommend. Instead I am wondering why the master(s) are not able to keep up with the database updates.

Do you have specific graphs from the ido queue items (returned icinga check for instance) in Grafana, and also all other system metrics when these performance bottlenecks occurs? How’s the database server health in general, like are there slow queries in the logs, is it tuned for using more memory than the default, etc?

Also, with the central MySQL cluster and VIP in the middle, I’d assume that memory only increases on the master which has the IDO feature active, while the other master continues to run?

Cheers,
Michael

Baremetal MySQL currently handles 5000 events per second, and i have a feeling that i can put 10000-15000 events per/sec and it will still works good

my current MySQL conf looks like

[mariadb]
log_error=/var/log/mysql/mariadb.err
character_set_server=utf8
innodb_buffer_pool_size = 10G
innodb_log_file_size = 512M
innodb_log_buffer_size = 128M
;innodb_lock_wait_timeout=10

innodb_file_per_table = 1
; Number of I/O threads for writes
innodb_write_io_threads = 28
; Number of I/O threads for reads
innodb_read_io_threads = 4
innodb_buffer_pool_instances = 32
max_allowed_packet=2M

innodb_io_capacity = 3000
innodb_io_capacity_max = 4000
binlog_format=row

innodb_thread_concurrency = 0
innodb_flush_log_at_trx_commit = 2
innodb_flush_method = O_DIRECT

IOwait and CPU load at 0 right now, system have around 700 tps

iostat statistics for last minute

Icinga2 Masters dies in both scenarios - with and without DB IDO enabled, and as far as i can see it’s all about check result messages that should be processed.

Main founding for me was that Master accepts too much messages through Icinga2 Data Exchange from Icinga satellites, and it simply not able to process/drop them all and get killed.
With dead master satellites continue to write data in database and schedule checks, but i’m out of possibility to make any changes on cluster through Director and not able to add new clients(to sign cert by master)

I know that i have only 8 core master and queue is mostly CPU bond regarding your technical concepts, even if i provide 32 cores, optimal system bandwidth on master should be around 7000 events per second, but it will still be behind my goal: 25000 events per second :sob:

Also, the third scenario is something we generally don’t recommend.

Yeah but application architecture looks nice for it, i tested it on lower amount of agents, it works just perfect, it would allow to decrease load on master and allow it to handle only API / Configuration work, without it we will always have a limitation in 2 hosts, even with upcoming IcingaDB feature application will need to analyze check result queue before writing it into Redis :slight_smile:

I’ll try to collect some graphs with performance data for you tomorrow

5 Likes

Graphs from 2019-11-22 12:00:00 to 2019-11-23 02:00:00, Second test

Unfortunately collected graphs from Master-1/Master-2 and they are ragged because of load, but represent general picture

3 Likes

It’s time to continue my testing story with 2 additional tests

For comparison reasons i decided to make tests with Standalone Icinga2 Master instead of HA zone for masters. Satellite zones are still in HA mode.

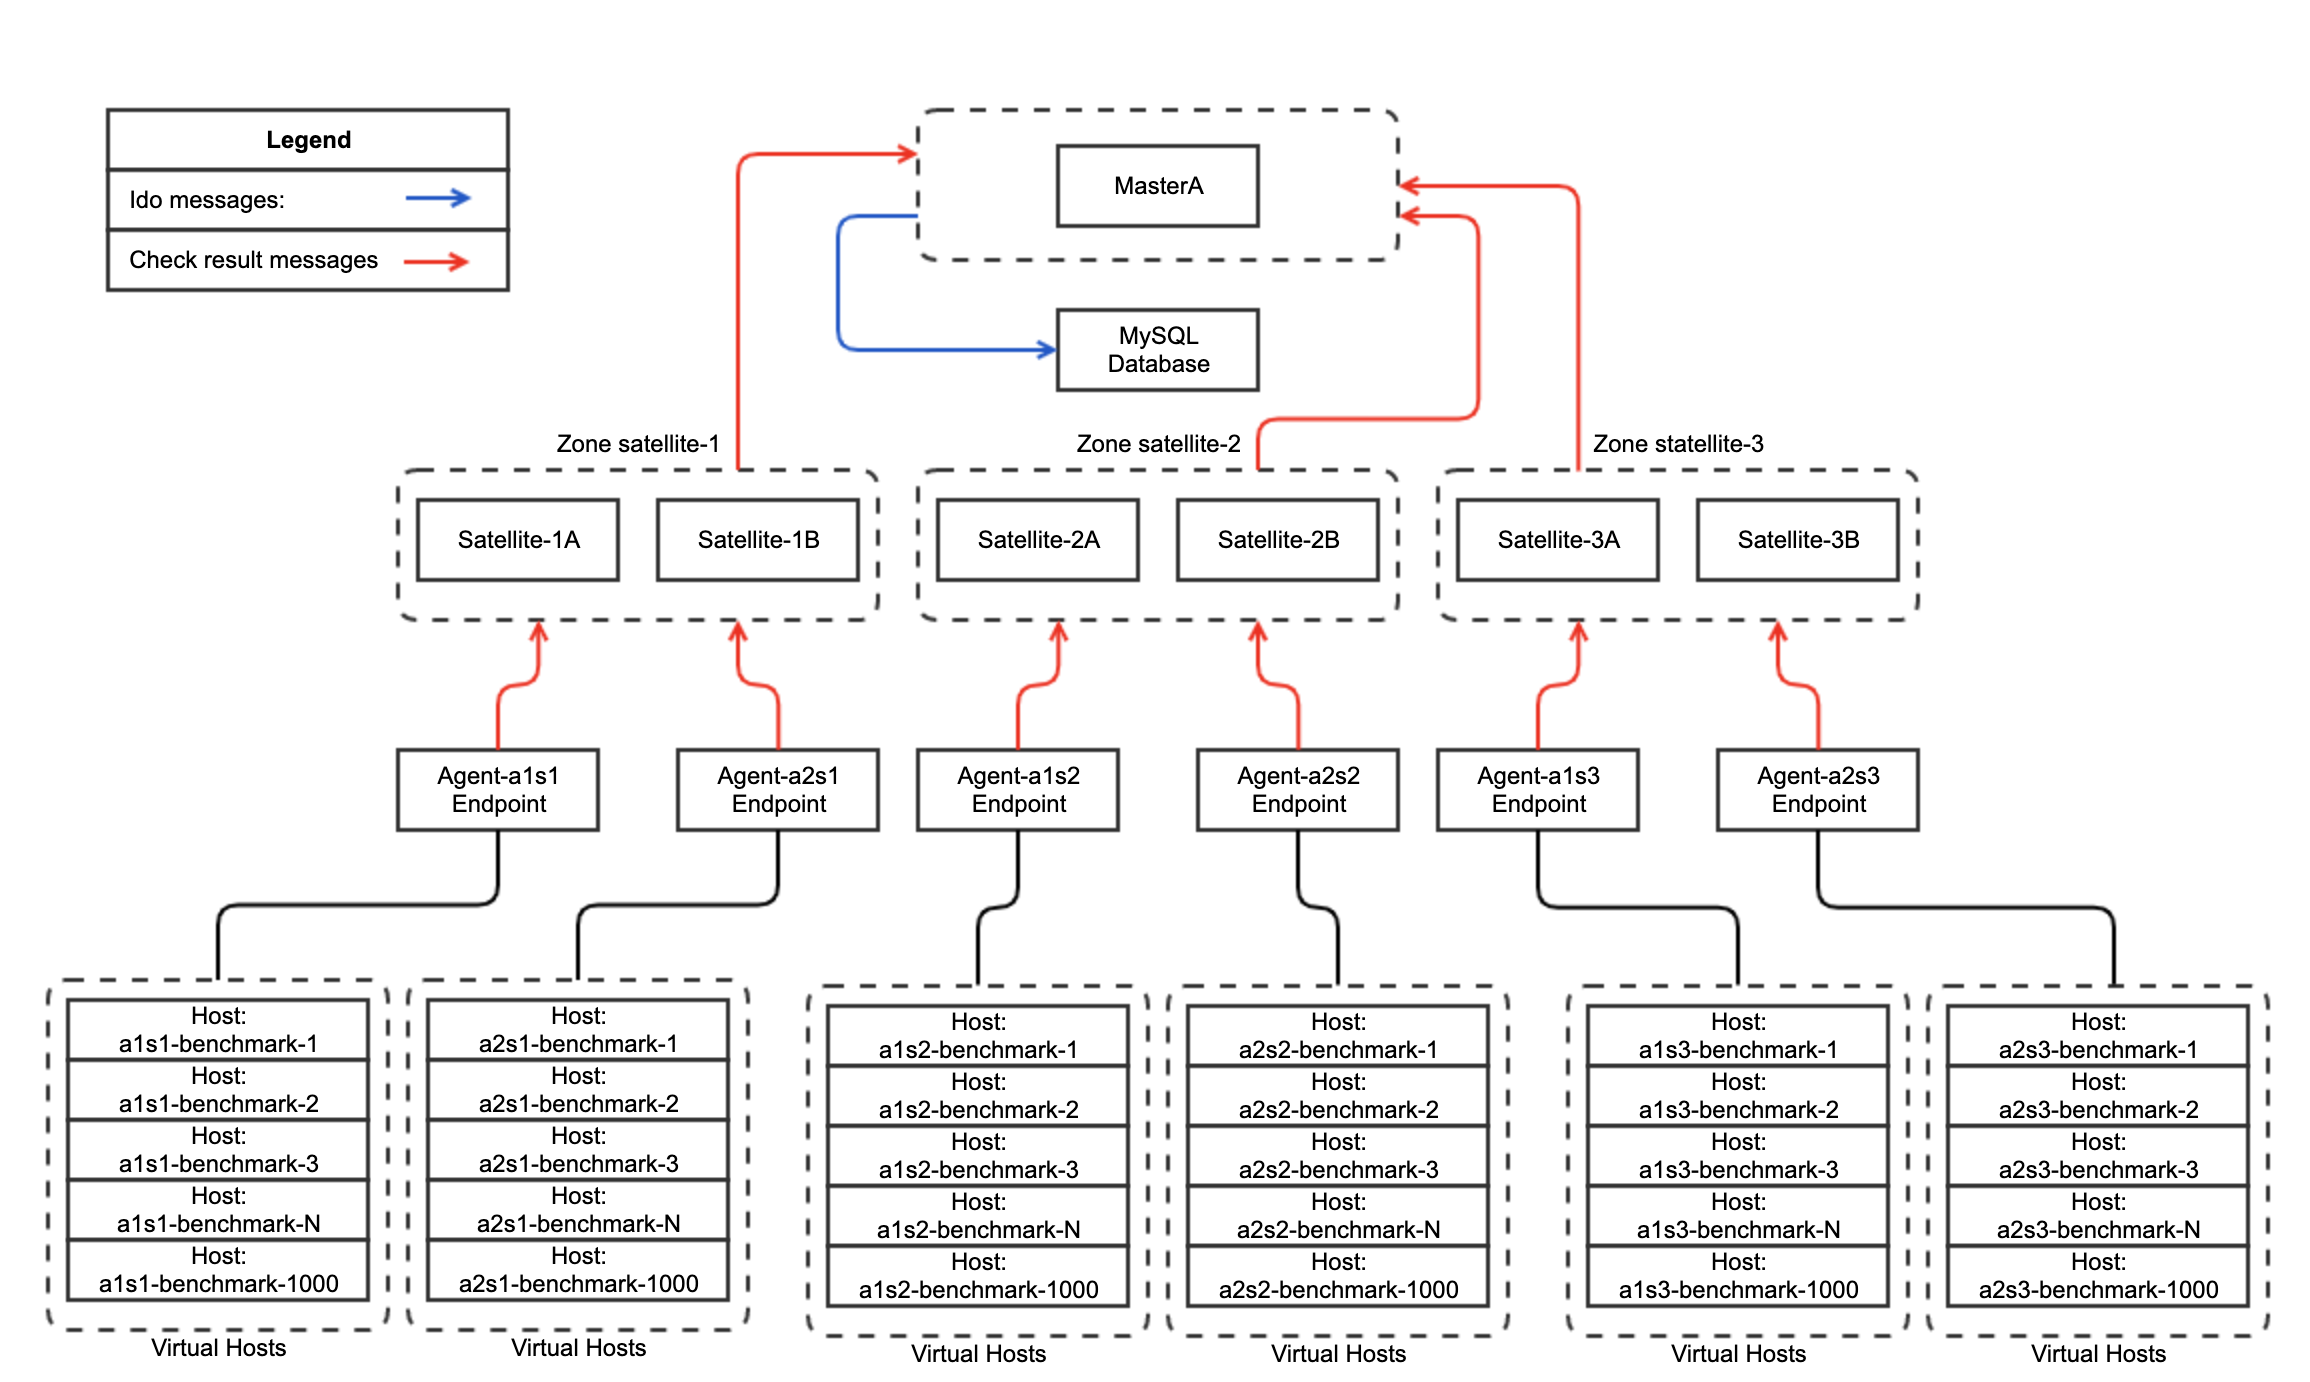
Fourth test - In this test i followed official Icinga2 documentation, IDO feature enabled on Icinga2 Standalone Master only.
1 MySQL Database instance: CPU: x8(CPU MHz: 2394) RAM: 16GB
1 Masters in standalone mode, CPU: x8(CPU MHz: 2394) RAM: 16GB
6 Satellites in HA (3 Satellite Zones), CPU: x8(CPU MHz: 2394) RAM: 16GB
6 Icinga2 Agents, 2 agents per each Satellite Zone, CPU: x4(CPU MHz: 2394) RAM: 4GB

Configuration schema:

Test showed the almost same cluster performance as in Test 1 , Icinga2 master not able to utilize all resources and send all incoming check results to MySQL, it cause to huge IDO queues and finally deamon get killed by system OOM killer.


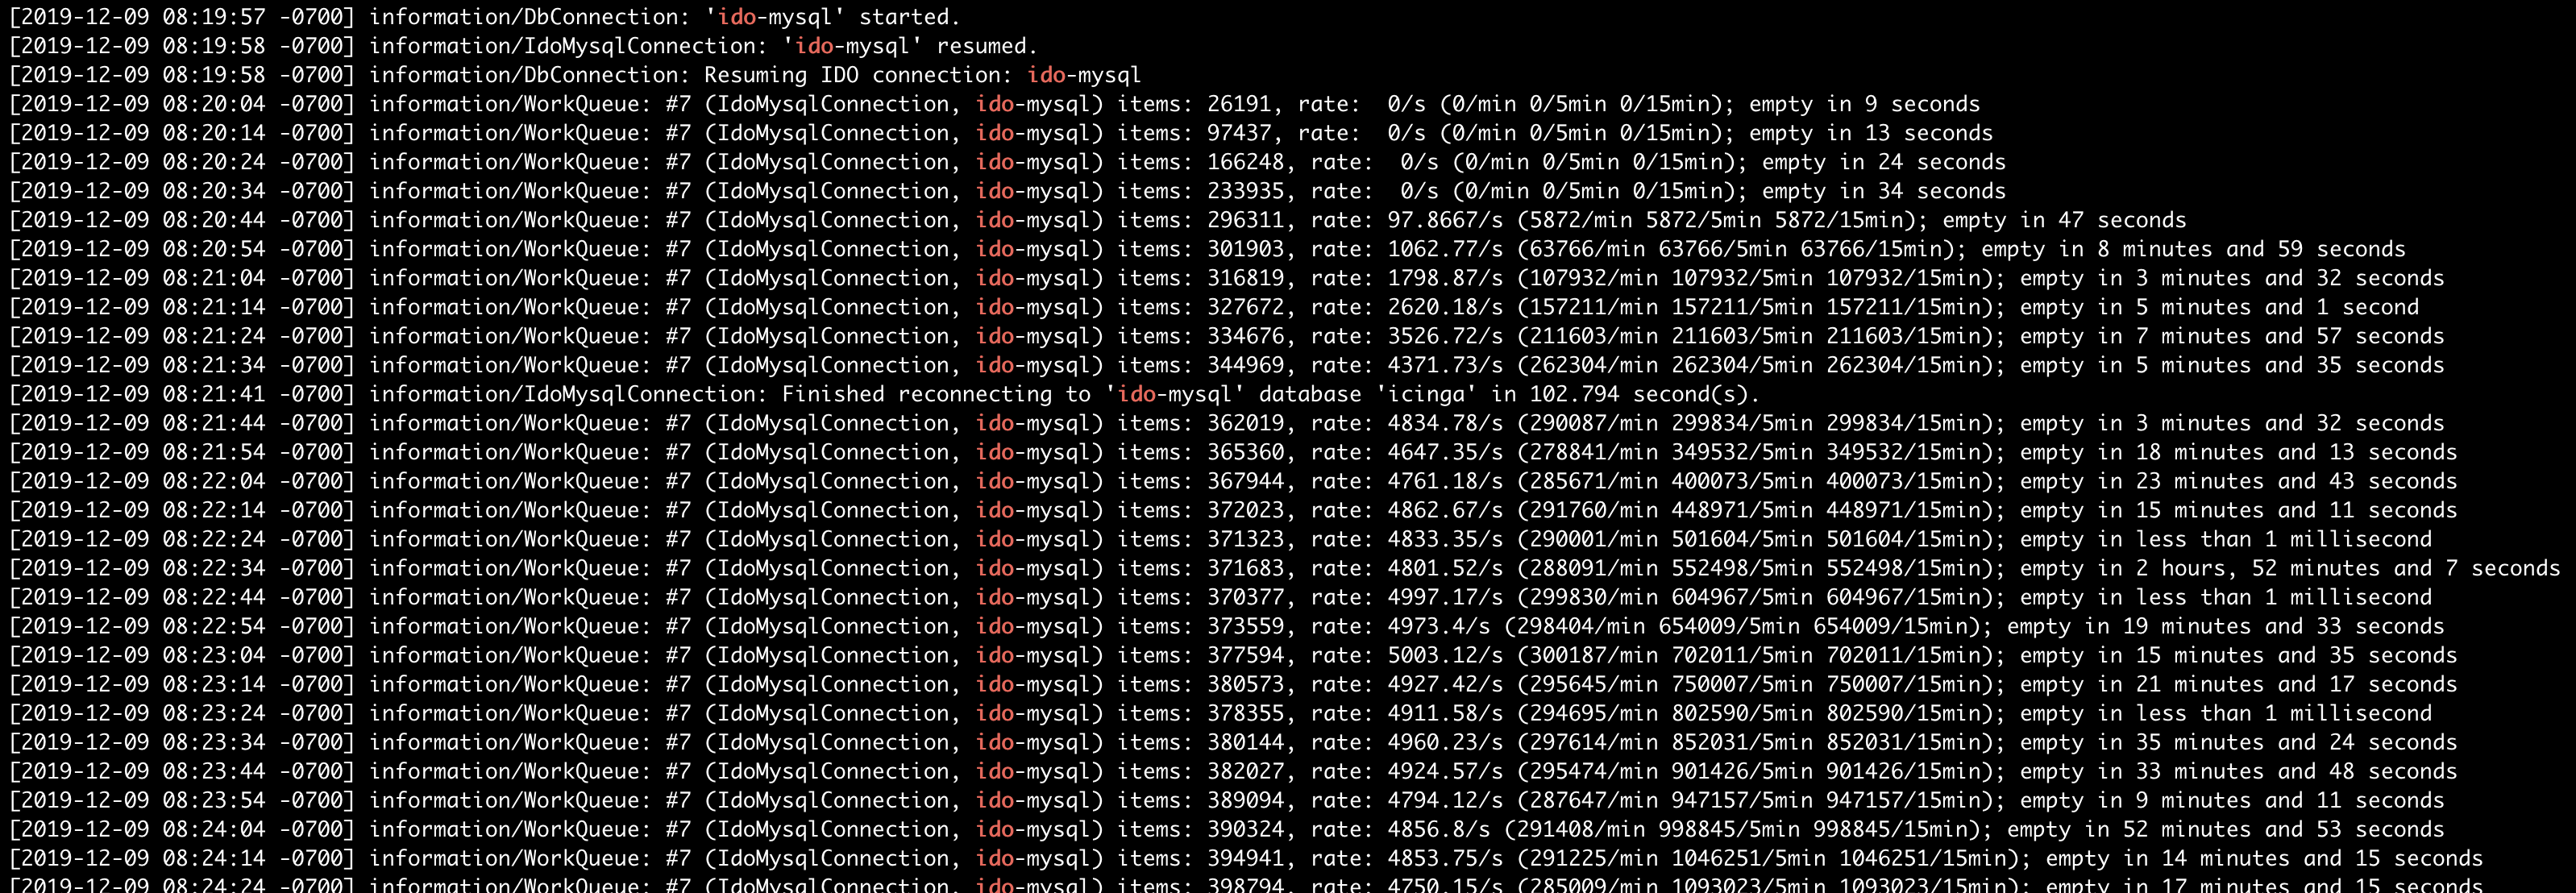
After 3000 hosts, Icinga2 Master not able to handle all incoming IDO queue.

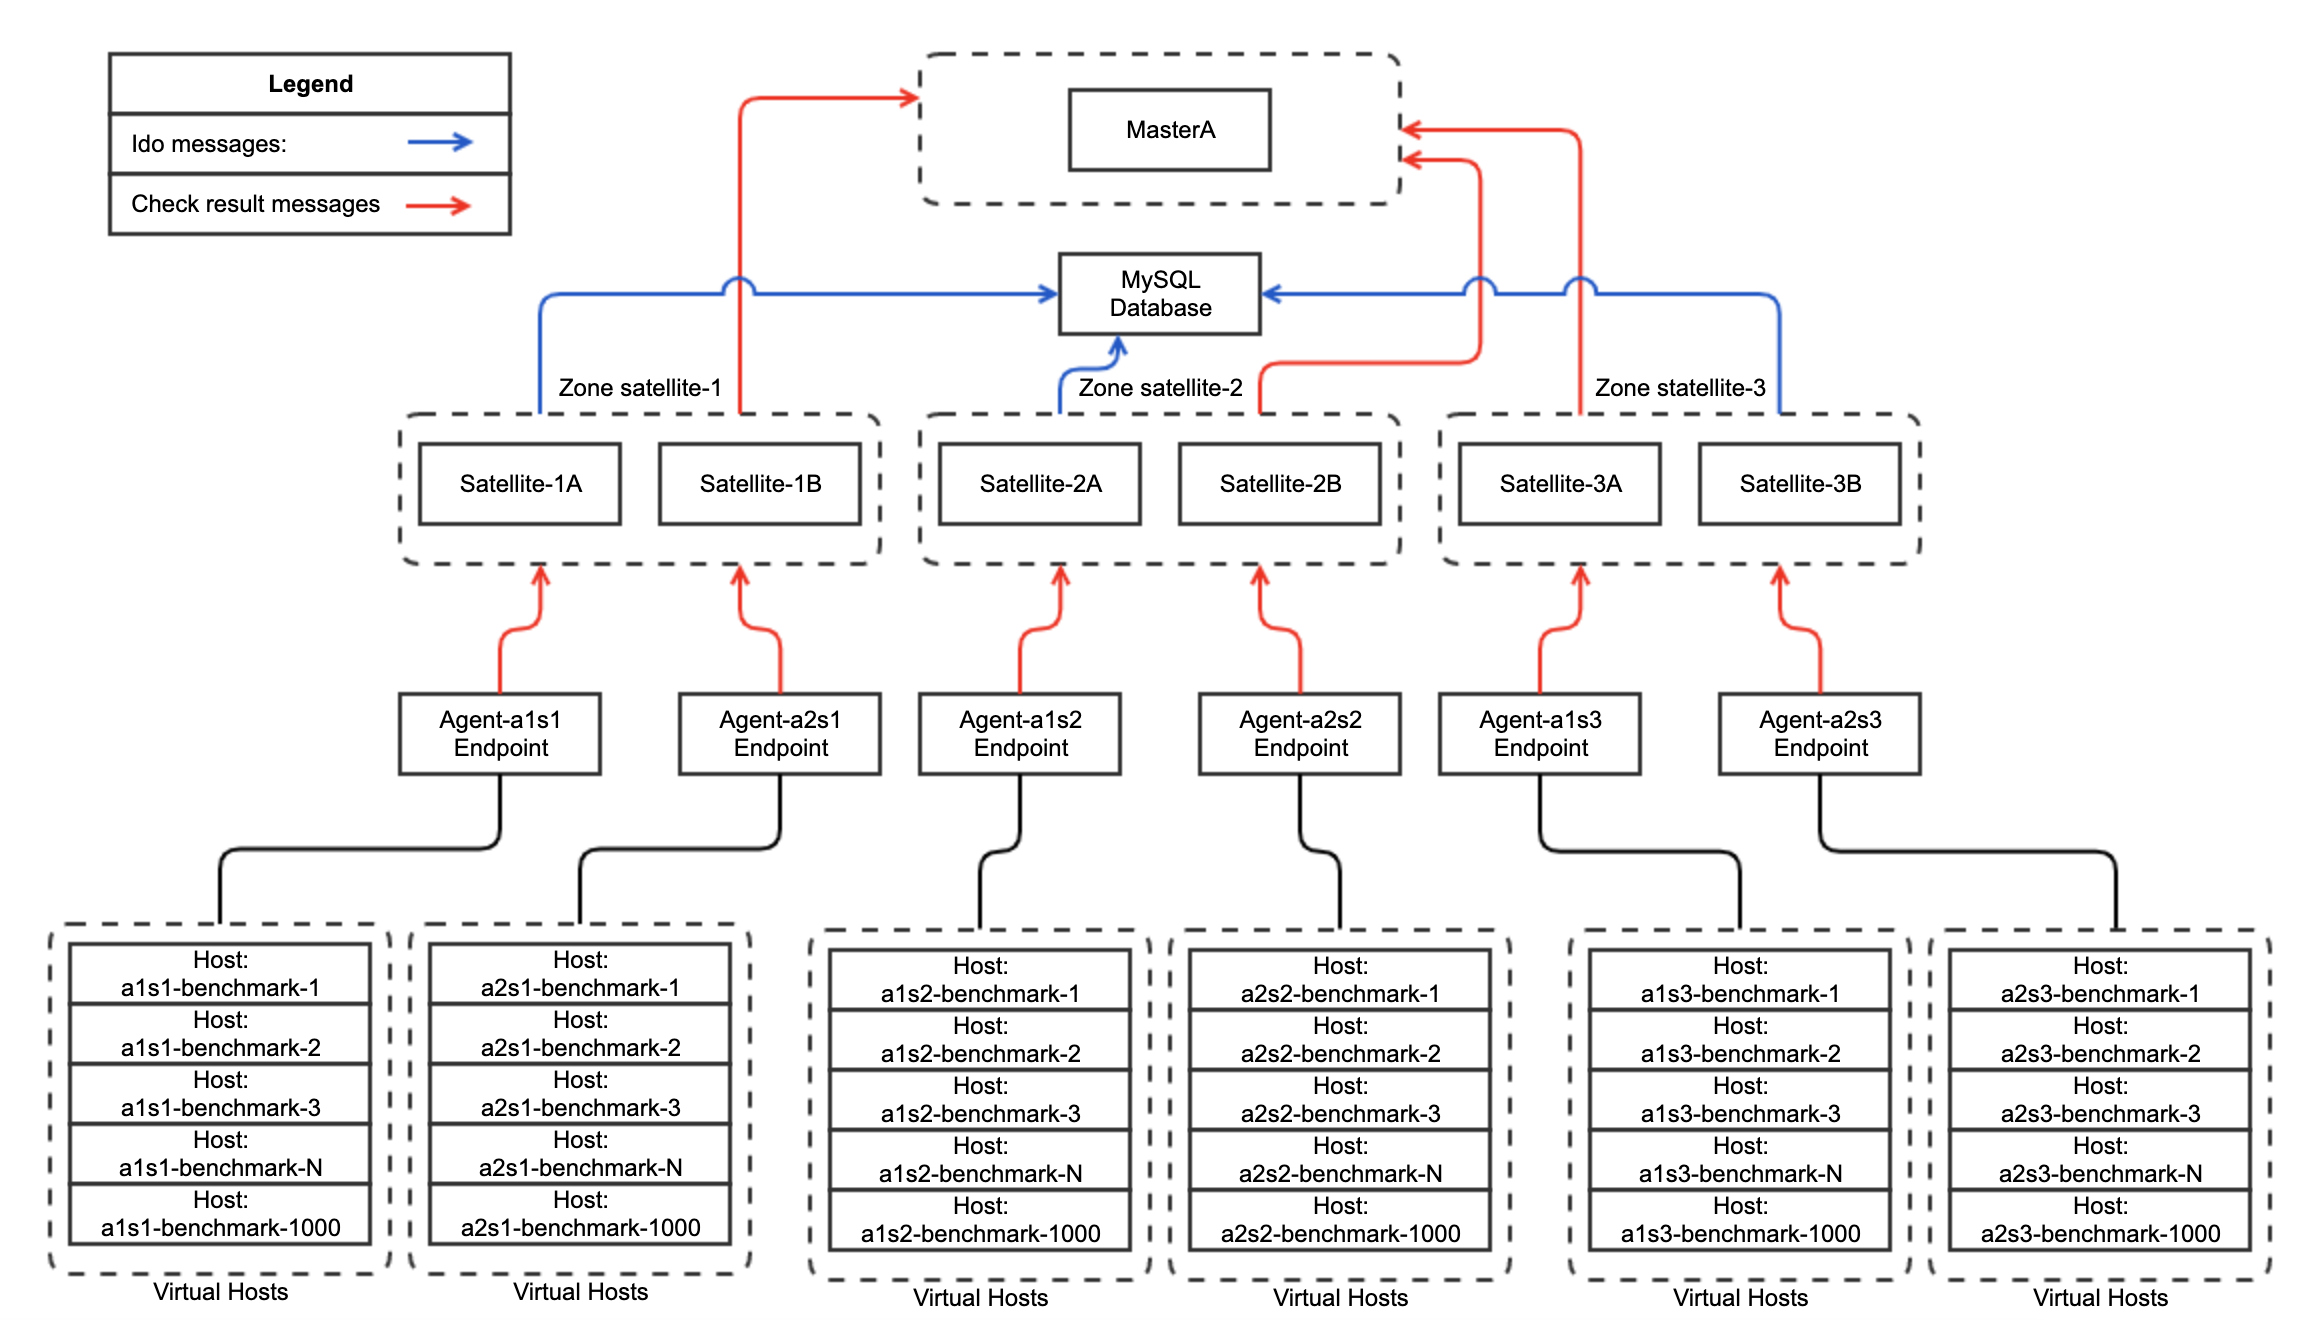
Fifth test - configuration schema have the same logic as i described in Third test, IDO feature enabled on Icinga2 Satellite Endpoints.
Also i rebuild cluster with more Satellites.
1 MySQL Database instance: CPU: x8(CPU MHz: 2394) RAM: 16GB
1 Masters in standalone mode, CPU: x8(CPU MHz: 2394) RAM: 16GB
18 Satellites in HA (9 Satellite Zones), CPU: x8(CPU MHz: 2394) RAM: 16GB
18 Icinga2 Agents, 2 agents per each Satellite Zone, CPU: x4(CPU MHz: 2394) RAM: 4GB

Configuration schema example(naturally contain 9 satellite zones):

And here i have something really interesting to share:

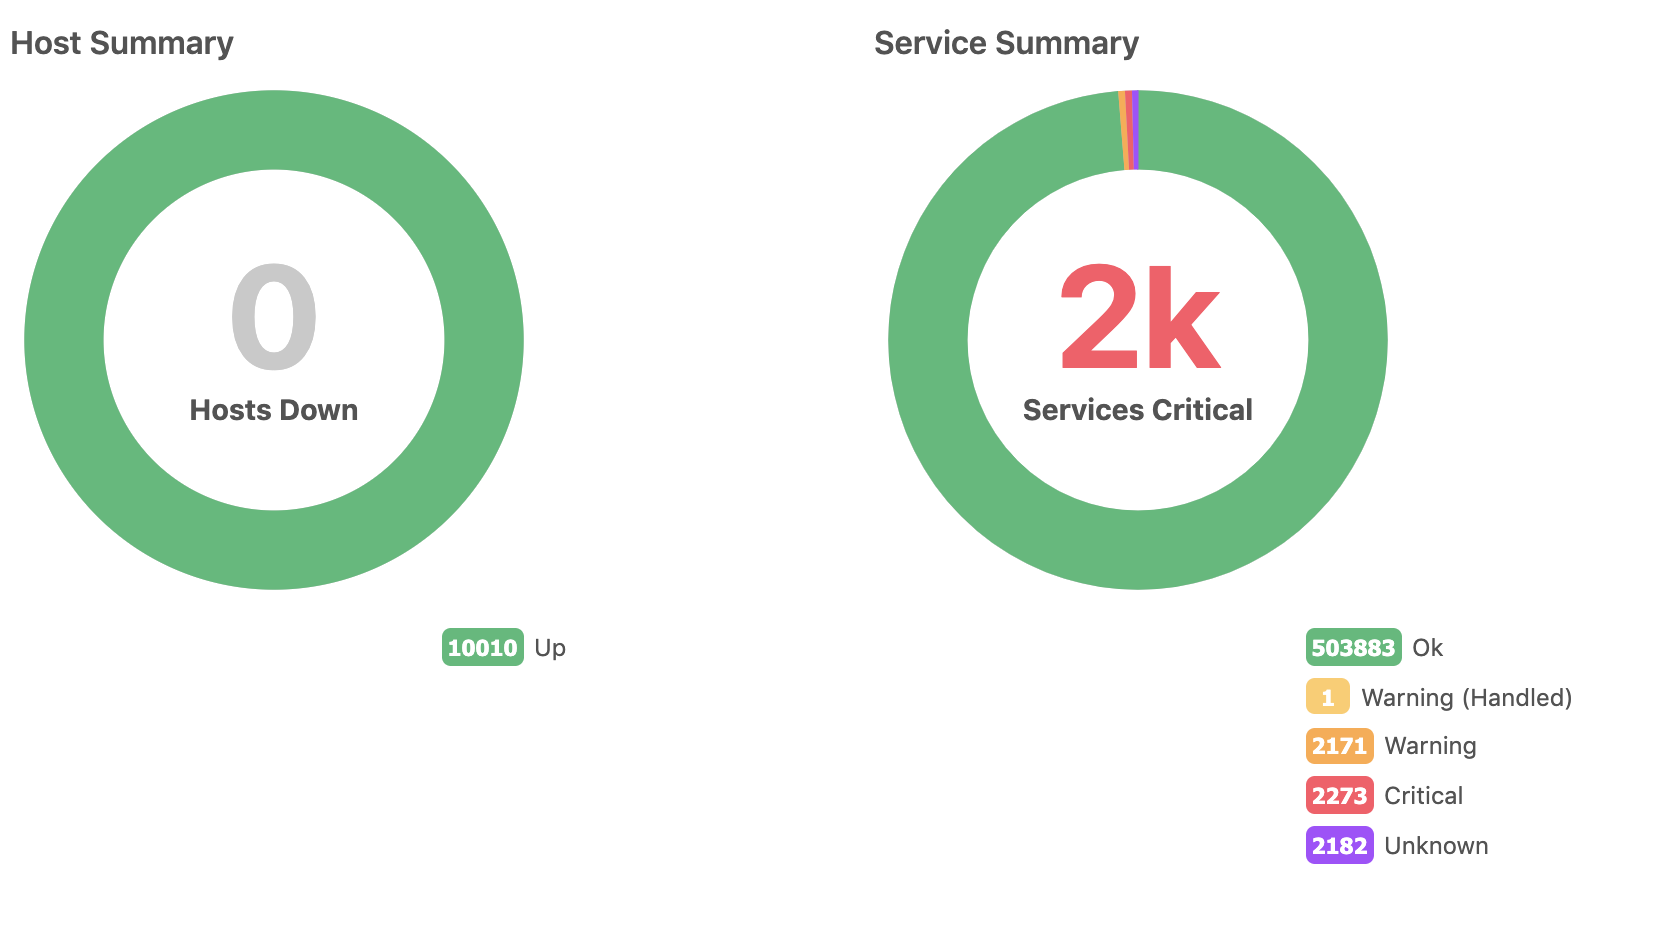
Have a first solid milestone in testing, 10k hosts, about 8400 events per second. Interesting founding that memory leaks stopped completely.

Here is RelayQueue logs:

[2019-12-12 06:24:02 -0700] information/WorkQueue: #5 (ApiListener, RelayQueue) items: 1341, rate: 42606.6/s (2556396/min 12794928/5min 38846066/15min);
[2019-12-12 06:24:12 -0700] information/WorkQueue: #5 (ApiListener, RelayQueue) items: 179, rate: 42690.1/s (2561407/min 12807613/5min 38914856/15min);
[2019-12-12 06:24:22 -0700] information/WorkQueue: #5 (ApiListener, RelayQueue) items: 2, rate: 42512.4/s (2550745/min 12792016/5min 38937682/15min);
[2019-12-12 06:24:32 -0700] information/WorkQueue: #5 (ApiListener, RelayQueue) items: 10, rate: 42540.4/s (2552425/min 12805184/5min 38961697/15min);
[2019-12-12 06:24:52 -0700] information/WorkQueue: #5 (ApiListener, RelayQueue) items: 42, rate: 42437.2/s (2546230/min 12800608/5min 39000197/15min);
[2019-12-12 06:25:22 -0700] information/WorkQueue: #5 (ApiListener, RelayQueue) items: 24, rate: 42100.5/s (2526029/min 12795742/5min 39073217/15min);
[2019-12-12 06:25:32 -0700] information/WorkQueue: #5 (ApiListener, RelayQueue) items: 12, rate: 41916.2/s (2514970/min 12796443/5min 39074377/15min);
[2019-12-12 06:25:52 -0700] information/WorkQueue: #5 (ApiListener, RelayQueue) items: 1, rate: 42035.8/s (2522148/min 12814652/5min 39099364/15min);
[2019-12-12 06:26:22 -0700] information/WorkQueue: #5 (ApiListener, RelayQueue) items: 258, rate: 42451.9/s (2547115/min 12839445/5min 39172641/15min);
[2019-12-12 06:26:32 -0700] information/WorkQueue: #5 (ApiListener, RelayQueue) items: 1, rate: 42479.3/s (2548759/min 12844078/5min 39203415/15min);
[2019-12-12 06:26:42 -0700] information/WorkQueue: #5 (ApiListener, RelayQueue) items: 271, rate: 42487/s (2549220/min 12821474/5min 39210678/15min);
[2019-12-12 06:26:52 -0700] information/WorkQueue: #5 (ApiListener, RelayQueue) items: 40, rate: 42239.2/s (2534349/min 12802741/5min 39196745/15min);
[2019-12-12 06:27:02 -0700] information/WorkQueue: #5 (ApiListener, RelayQueue) items: 2, rate: 42231/s (2533858/min 12786579/5min 39141632/15min);
[2019-12-12 06:27:22 -0700] information/WorkQueue: #5 (ApiListener, RelayQueue) items: 202, rate: 41704.4/s (2502264/min 12766433/5min 39016238/15min);
[2019-12-12 06:27:32 -0700] information/WorkQueue: #5 (ApiListener, RelayQueue) items: 27, rate: 41635.7/s (2498142/min 12758562/5min 38964173/15min);
[2019-12-12 06:28:12 -0700] information/WorkQueue: #5 (ApiListener, RelayQueue) items: 1, rate: 42651.8/s (2559105/min 12794018/5min 38824881/15min);
[2019-12-12 06:28:22 -0700] information/WorkQueue: #5 (ApiListener, RelayQueue) items: 1, rate: 42846.8/s (2570810/min 12801761/5min 38791080/15min);
[2019-12-12 06:28:32 -0700] information/WorkQueue: #5 (ApiListener, RelayQueue) items: 5, rate: 42858.4/s (2571507/min 12788852/5min 38735522/15min);

Current rate of messages around 42k per sec, looks much better compared to 15k p/sec in third test.

Database iostat 5 minute statistics still looks good on this workloads.

Icinga2 Master workload:

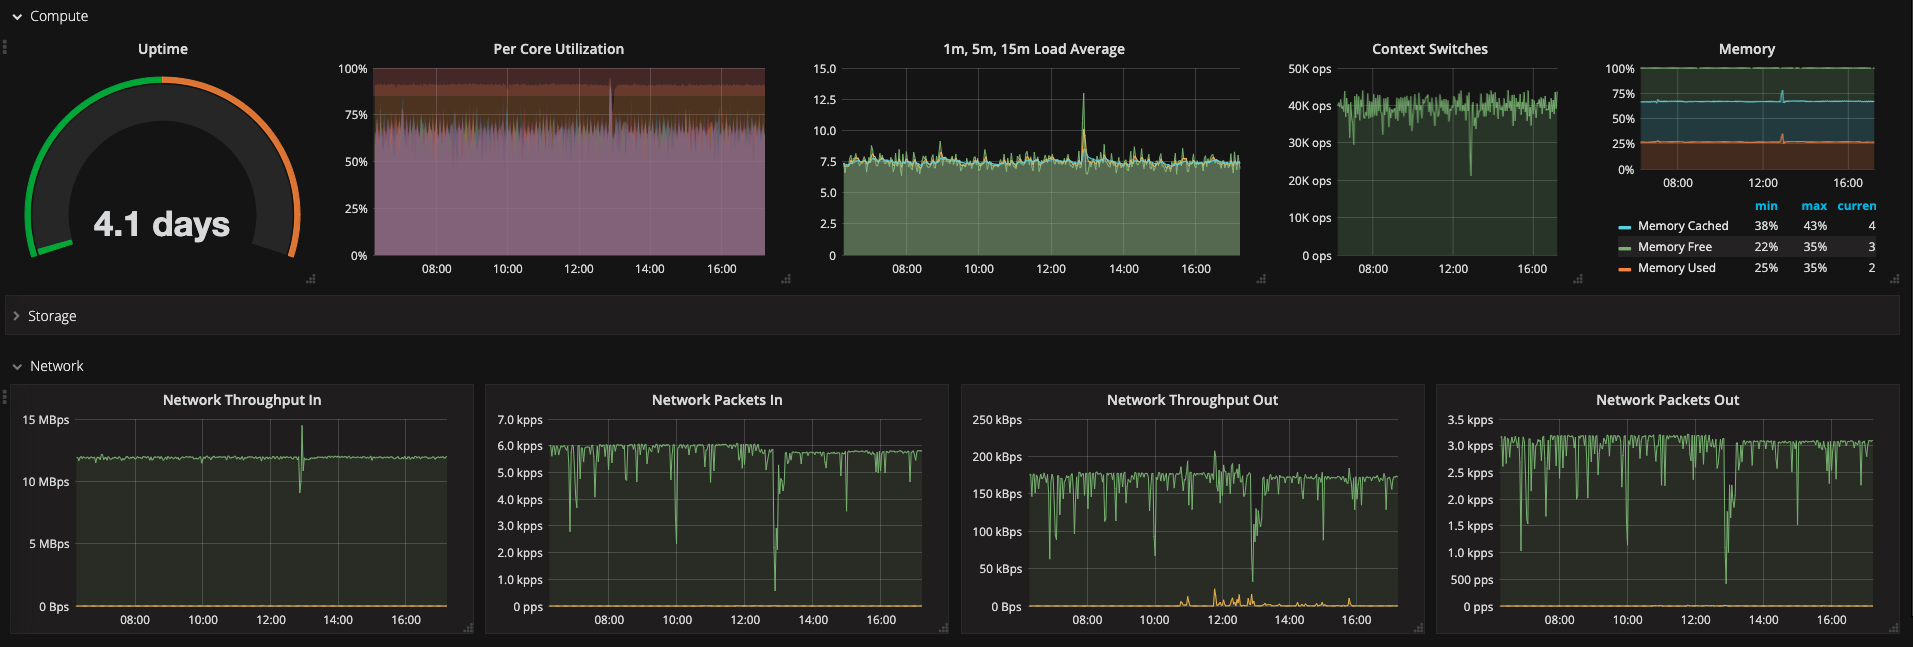
Icinga2 master regular workload ~8 LA, during configuration deployment we can track load spikes to 12-15 LA for the short term.
Configuration propagation in the system takes around 5-6 minutes, time calculated from pressing “Deploy” button in Director to getting hosts visualized in Tactical Overview with Pending status

Note: Current cluster limit is not reached and i’ll add more Hosts in current environment, currently want to track cluster stability.

P.S. Brief analysis show that we have:

  • huge overhead on HA cluster work, standalone master (with not recommended config schema) handles at least 3 times more without memory leaks compared to HA mode with same schema
  • low IDO queue utilization with Icinga2 process, not limited by system highload or MySQL performance
7 Likes

Have you modified your mysql conf since posting in early December? Would be curious to see what that configuration looks like after your latest test

Hello Richard, no, mysql conf haven’t changed since that time, all changes posted in this story :slight_smile:

1 Like

Awesome, We run a pretty large env and are definitely interested in your research. ~24k hosts / ~132k services. We run in ha (1 master, 2 satellites) in two different dc and definitely find that we hit IDO limits. At some point the queue gets so large Icinga will never be able to recover. We detect that queue depth and initiate reloads to bring the system back to health. Hence the reason I ask about your conf, going to check into those options to see if they help/hurt our environment. Great stuff by the way

To scale Icing2 in my way, you need to scale up satellite zones, try to put 2-3 satellite zones with 2 satellite endpoints in each zone.
Enable IDO feauture on satellites and disable it on master.
Key point in this configurtion is to set uniq instance_name option per satellite zone.

Example
File /etc/icing2/features-available/ido-mysql.conf

library "db_ido_mysql"

object IdoMysqlConnection "ido-mysql" {
  user = "icinga2",
  password = "icinga2",
  host = "db.example.com",
  database = "icinga2"
  instance_name = "uniq-satellite-zone-identifier-1"
  enable_ha = "true"
}

When satellite reachs out bandwidth limit, you will need to configure additional satellite zone, with my calculations 8 CPU core VM (CPU MHz: 2394) able to handle up to 2500 events per second, but the recomendation to keep it on 1500-2000 events per second for fast IDO queue utilization in case of service reloads or any kind of short outages.

1 Like

I came across this thread dealing with a similar issue… “IDO can’t keep up” on a large system (about 55k service checks a minute with the checks spread over a small cluster). While I’ve been struggling to squeeze more performance out of the MariaDB server in order to avoid asking people who don’t like to buy stuff to buy more stuff, I wonder if there’s a case here for a feature addition to IDO.

The vast majority of writes are to the status tables on a typical system (based on debug logging), since those get updated with every check. I also assume, based on what I see in the web interface, that these are getting backlogged…(next check in -6 minutues…-8 minutes…-23 minutes…until the oom-killer stops icinga altogether).

What if the IDO feature had an “allow lossy statusdata” option? I think that’s kind of what you are accepting with the auto-restarts you’ve implemented. Instead of allowing that WorkQueue to grow and grow…and constantly updating the status tables with out-dated info anyway… have a mechanism to stop piling on updates (of active checks),until the queued items came down below a threshold. It wouldn’t be for everyone, but in my case I could live with that since everything else seems to keep up (no check latency, all performance data is captured, notifications would go out, etc.). It would also avoid the memory depletion that eventually halts the service.

Just an idea for now, and thought I’d throw it out there to see what people think.

The things mentioned are amongst other schema drawbacks the drivers for creating Icinga DB as a new backend. Currently its first released version is blocked with a critical bug inside Icinga 2, 2.12-RC, specifically https://github.com/Icinga/icinga2/issues/7532.

3 Likes

Thanks @Solkren for sharing the great and interesting information.I will use it to scrutinize my Icinga Infra as I remember seeing the IDO messages saying “You DB can’t keep up with…”

@dnsmichi Does that mean that there will be an improved DB schema in 2.12?
Is enabling the IDO feature on the satellites supported?

Thanks

Hi,

IcingaDB is a whole new backend architecture, and will replace the IDO backend in the future.

The short-cut architecture looks like this:

Icinga 2 Core -> IcingaDB feature -> Redis -> IcingaDB daemon -> DB backend (history, config) & Redis (states & volatile data) -> Icinga Web module.

The required components will be provided with Icinga 2 v2.12, Icinga Web 2 v2.8 and new projects: IcingaDB daemon, and a new Web module.

Currently the JSON-RPC bug is holding of the entire release chain, with Icinga 2 being a key core component required for this new architecture.

To my knowledge - and that is not taken as granted, as things may change - the first Release Candidates will add MySQL as backend, with PostgreSQL following up. Also, requirements like data migration from IDO or updating existing web modules to the new backend framework are an ongoing task after RC1.

The latest update on this can be watched in the OSMC talk by @berk.

In terms of satellites and IDO - you can do that, but that’s just a local backend then. There’s no plans to extend this e.g. like shown above with different instance_ids in a central DB cluster and what not. Also, it will be hard to get support for that as we do not encourage this as best practice.

Cheers,
Michael

1 Like

Hello Michael,
I know it’s kinda hard to provide/predict any estimates for fixing this JSON-RPC bug, but do we have any insights when it could be fixed? Any info is appreciated :slight_smile:

With best regards,
Dmitriy.

Hi,

asking for an ETA honestly is one of the worst things you can do in this situation, no offense here.

I’ll also tell you why - imagine that you’ve got a problem, and you have tried 20 different things to tackle it. Your mood ranges from frustration to the emotion of nearly having tackled the problem. Being on that emotional ride, always trying new things from new findings.

First off, you had problems with reproducing the problem reliably.

Then there is the thing that no-one is there to help you. You need to tackle the problem alone, Google everything, analyse your code, re-consider every change you made in the past year.

You may have a colleague who joins you, and other colleagues who help with testing, the “maybe solutions” you’ll provide. Oh, it failed again. Gaining motivation to strive further is hard, even if that’s the job you’re getting paid for.

At this very stage you have knowledge about deploying a large scale Icinga cluster with Ansible, Terraform in AWS, DO, NWS. And you don’t want to look onto the monthly bills coming soon.

Then you’ll reach a point where the problem is mitigated with disabling a feature. “oh yay, it is fixed.” No, actually not. You’ll need to find a way to fix it, with re-enabling the feature or code you just removed to find the spot.

You’ll know that you’ve invested 3 months time already. With the problem always taking 2 long days being seen again, in a large scale clustered environment only.

In parallel to all to the above, you get asked nearly daily about the status and when a fix will be available. There’s two sorts of users: Those you want to have IcingaDB, and those who expect that they get a 2.11.x point release.

And sometimes, you are lucky to have your team lead capture that for you, so you don’t get stressed out by that.

And of course, you need to have a plan B,C and D if your current strategy doesn’t pay off. That’s not the best feeling you’ll have during the day.

At the very moment there are all 4 core developers and our team lead assigned to this task, nearly full time.
If there would be more people debugging, with different ideas and insights, this would truly lead to faster results and better distributed views.

Help out

Everyone can start in the development chapter, there’s the possibility to test the snapshot packages, dive deep into the code and add your findings with logs, core dumps, analysis, etc.

There’s even a chance that a programming error can be detected with static/runtime code analysis tools we haven’t tried yet. If you know some, throw Icinga at it and try to extract valuable details.

Last but not least, always consider that everything we do here is within an Open Source project no-one initially pays anything for. Sometimes expectations are raised too high, and sometimes it is hard to imagine the other side, developers, project managers and their emotions.

I’d recommend to watch our Icinga 2.11 insights video, which also highlights some of the above: https://icinga.com/2019/10/25/icinga-2-11-insights-video-online/

That being said, we’re doing more than 100% to solve the problem. The more people join this journey, the better. :muscle:

Cheers,
Michael

PS: “You” in the above is @Al2Klimov who’s been doing a magnificent job in holding out here. I had given up multiple times already, coming back, motivated by @elippmann @nhilverling @htriem 's work. :+1:

13 Likes

Hi!

I have a master cluster with 5 Satellites, ~5000 Hosts, ~10000 Services and nothing is crashing here. Only found one crashlog from September. So, my question how many users do have that problem? Why do we not have this problem too? Is our environment to small? As we are not using Agents on linux, only on Windows, we have not much agent connections.

Sadly I’am not a real developer and can’t help much :frowning:

@Solkren , great thread and testing on large scale icinga installations.

I am working on a cluster as well, and final the landscape will have 66 zones.
Level 1 with 2 masters (HA), mysql backend, web
Level 2 with 7 satellite zones (14 servers HA), with their own mysql backend and web
Level 3 with 52 satellite zones (Some HA…some single)
In load testing, ido can no longer keep up on Level 1, when i hit 22K hosts, and 290K service checks reporting to the masters from the level 2 satellites. I am thinking about dropping Level 1 ido, single level 1 master, and setting Level 2 ido with the instance option and write to Level 1 master mysql like your setup, but how does icingaweb2 work…what does it see as the active node writing to the db? The level 1 icingaweb2 is to be single pane of glass seeing everything from the landscape.

Hello @powelleb,
thanks for the feedback, the only problem with Icingaweb in this configuration is that: icingaweb2/monitoring/health/info will show you only the information about first satellite zone connected to the database, icingaweb unfortunately reads only first id from table in the database and show statistic based on that. But the good news here that all hosts are visible and doesn’t have any conflicts inside database

Also i’ve tested icinga-agent move from one satellite zone to another, all works like a charm and it doesn’t make conflicts in database.

When everything is connected Icingaweb will read a single database and it makes queries based on host/service id + environmentid

Database: with that amount of clients take care to create daily partitions for tables like history and notifications they will grow with time, default database cleaner use delete methods and its fairly slow for this scale, with partitions you will be able to drop unnecessary data fast and without service interruptions.

Also there is 2.12RC available and soon(fingers-crossed) we will get a 2.12 released, 2.12 use redis with redis-streams which is really fast, so i hope it would be enough to have 2 baremetal masters that would handle all load, on the other side, for infinitive scaling current concept will not work in 2.12 with icingadb, at least i hope they will add support for this kind of setup later(modern micro-service architectures doesn’t really respect monsters like that and for simple management/update/upgrade all used to have a lot of small VMs, also it much more failure tolerant)

P.S. in your setup you have Level 3 with additional satellites, which makes extreme overhead in terms of data processing and management:
agent send data => Satellite L3 handle connection + transfer data => Satellite L2 transfer data + push data to the database => Master accepts data and drop it
I don’t see a real reason to use L3, i would just increase amount of satellites on L2

With best regards,
Dmitriy

Another idea is to use Icinga DB which was developed exactly for that scenario.