Here’s the graph in Grafana.
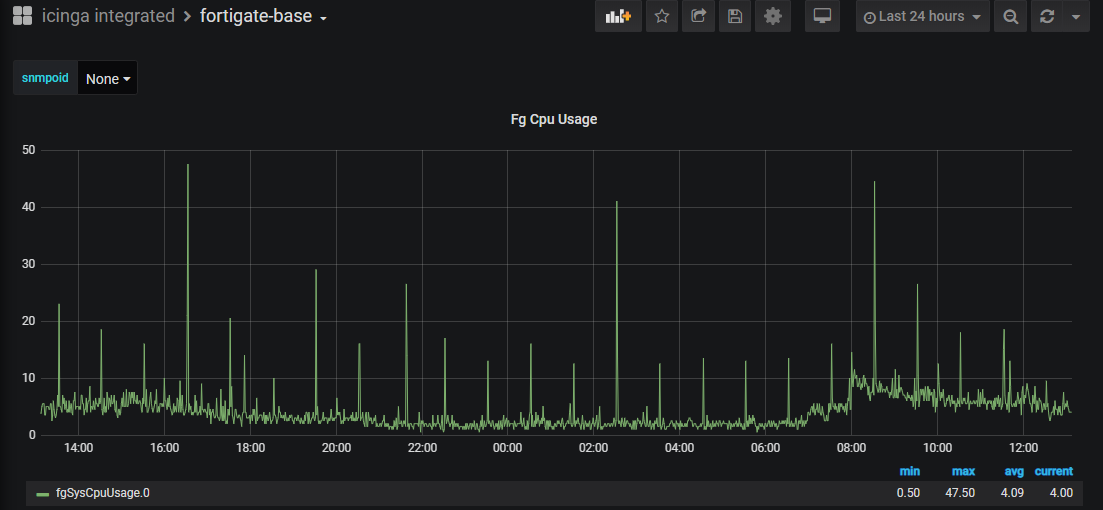
I’ve removed the custom variable in the Graph definition in Icinga and the CPU graph works now…
Though I don’t understand why, but it is using a very explicit configuration. I’m still bemused as to howto deploy across the interfaces without replicating a graph for each interface etc
I thought we talk about interface usage all the time. the cpu usage oid is the same on all hosts.
If you do the same for interface usage or want a template for all snmp checks (without unit then) you can do it like i descriped before.
Also you can set the “custvarconfig” in the module configuration. If this custom var is found in a service, the module will lookup a graph configuration with the value from this custom var.
For example you set the “custvarconfig” in the module to “mygraphconfig” and have this in your service definition
vars.mygraphconfig = "SNMP_Interface_Usage"
The module will load the graph configuration named “SNMP_Interface_Usage”.
Regards,
Carsten
I went back to trying to get the CPU working after failing to make dynamic for interfaces etc.
This is where you have lost me as it’s not clear which components are talking about.
I’m parking this for now, in a hope I can come back at some later time and solve.