Sure it is, because every interface have a different OID …
then I’m completely lost, this make no sense whatsoever.
are there any examples of this?
Give me a few minutes, i will post them, just takes some time (still working)
This is you given service
template Service "FORTINET-FORTIGATE-MIB::fgSysCpuUsage.0" {
   import "SNMP v1 Fortigate"

   check_command = "[snmp]"
   enable_perfdata = true  # unneeded, because the default is true :slight_smile:
   groups = [ "SNMP Checks" ]
   command_endpoint = null
   vars.snmp_community = "public"
   vars.snmp_miblist = "FORTINET-FORTIGATE-MIB"
   vars.snmp_oid = "fgSysCpuUsage.0"
   vars.snmp_version = "1"
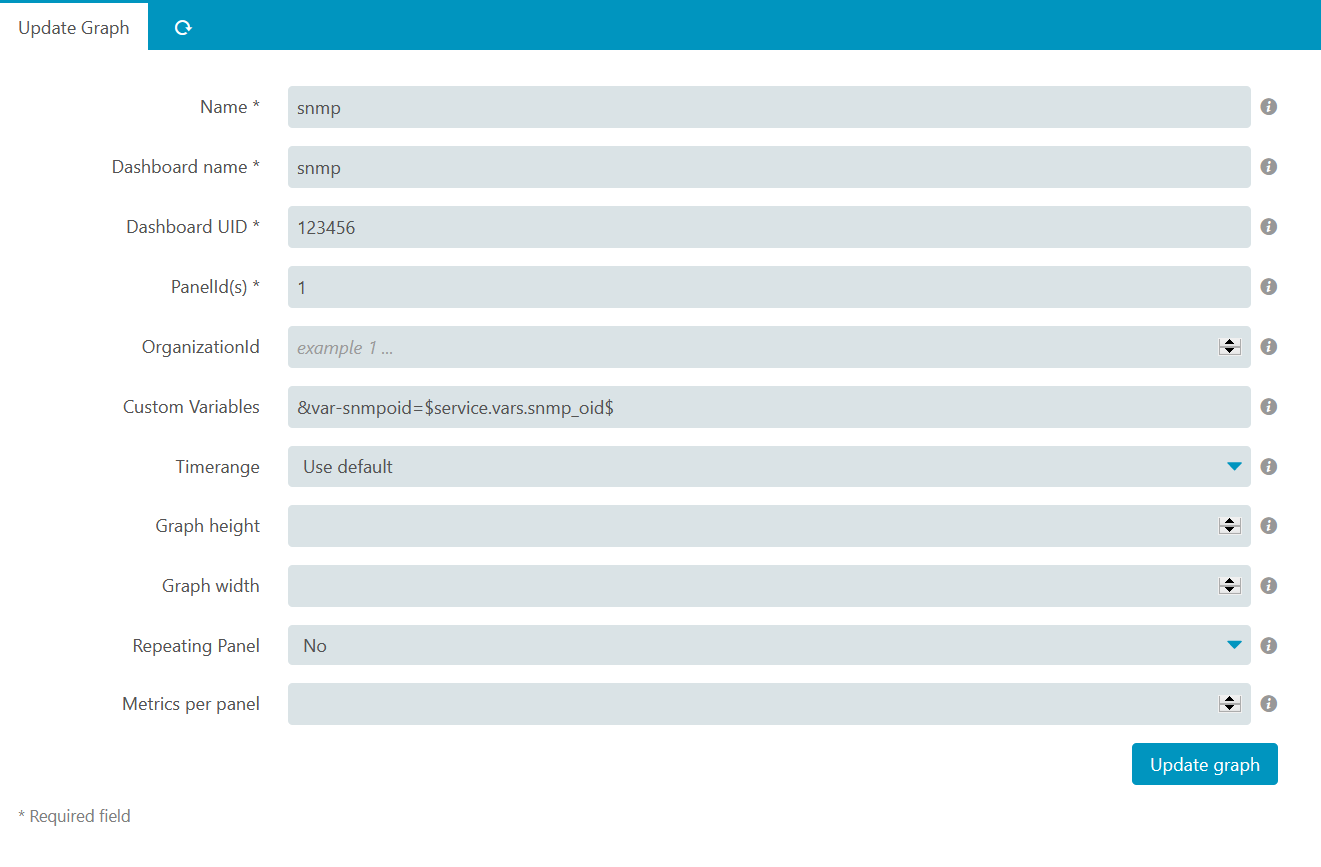
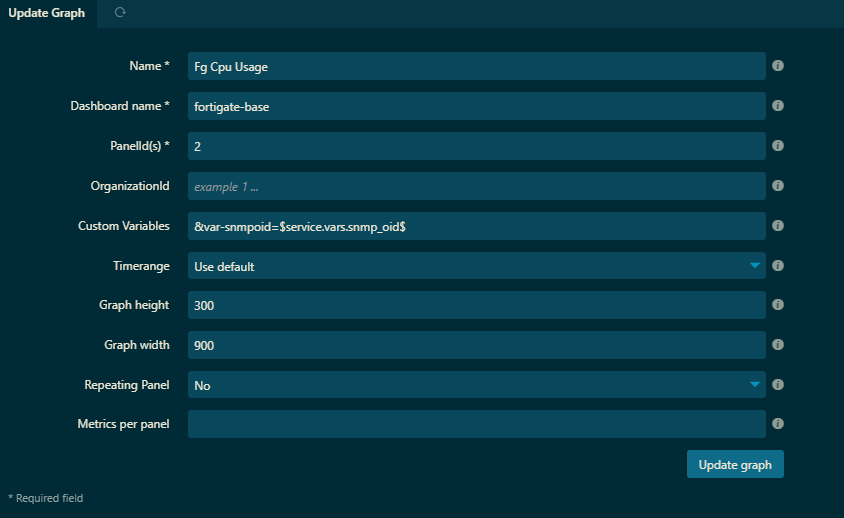
The graph config should be like this (replace uuid, pannelid and dashboard name with yours), it will be valid for all services named “snmp” or services with that uses the command snmp
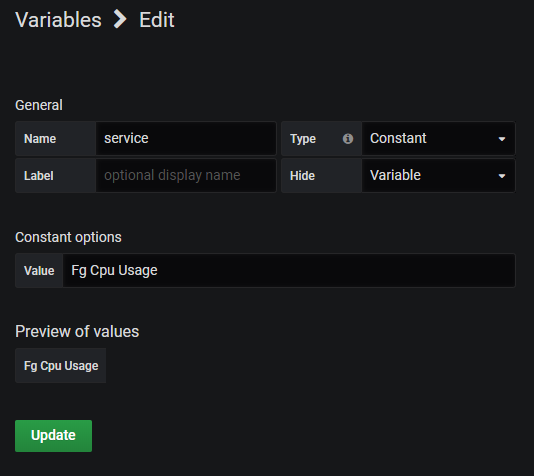
You variables in your Grafana dashboard should be
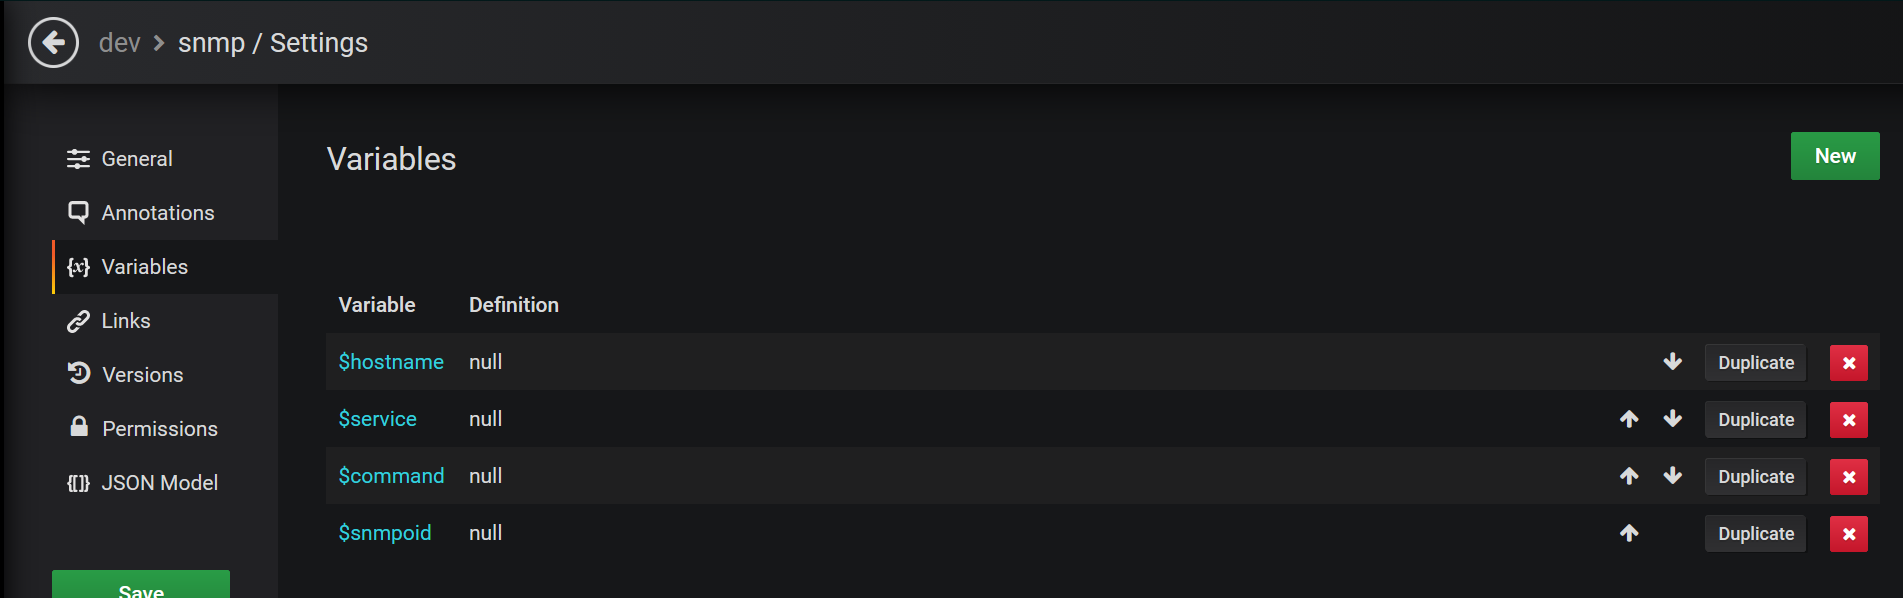
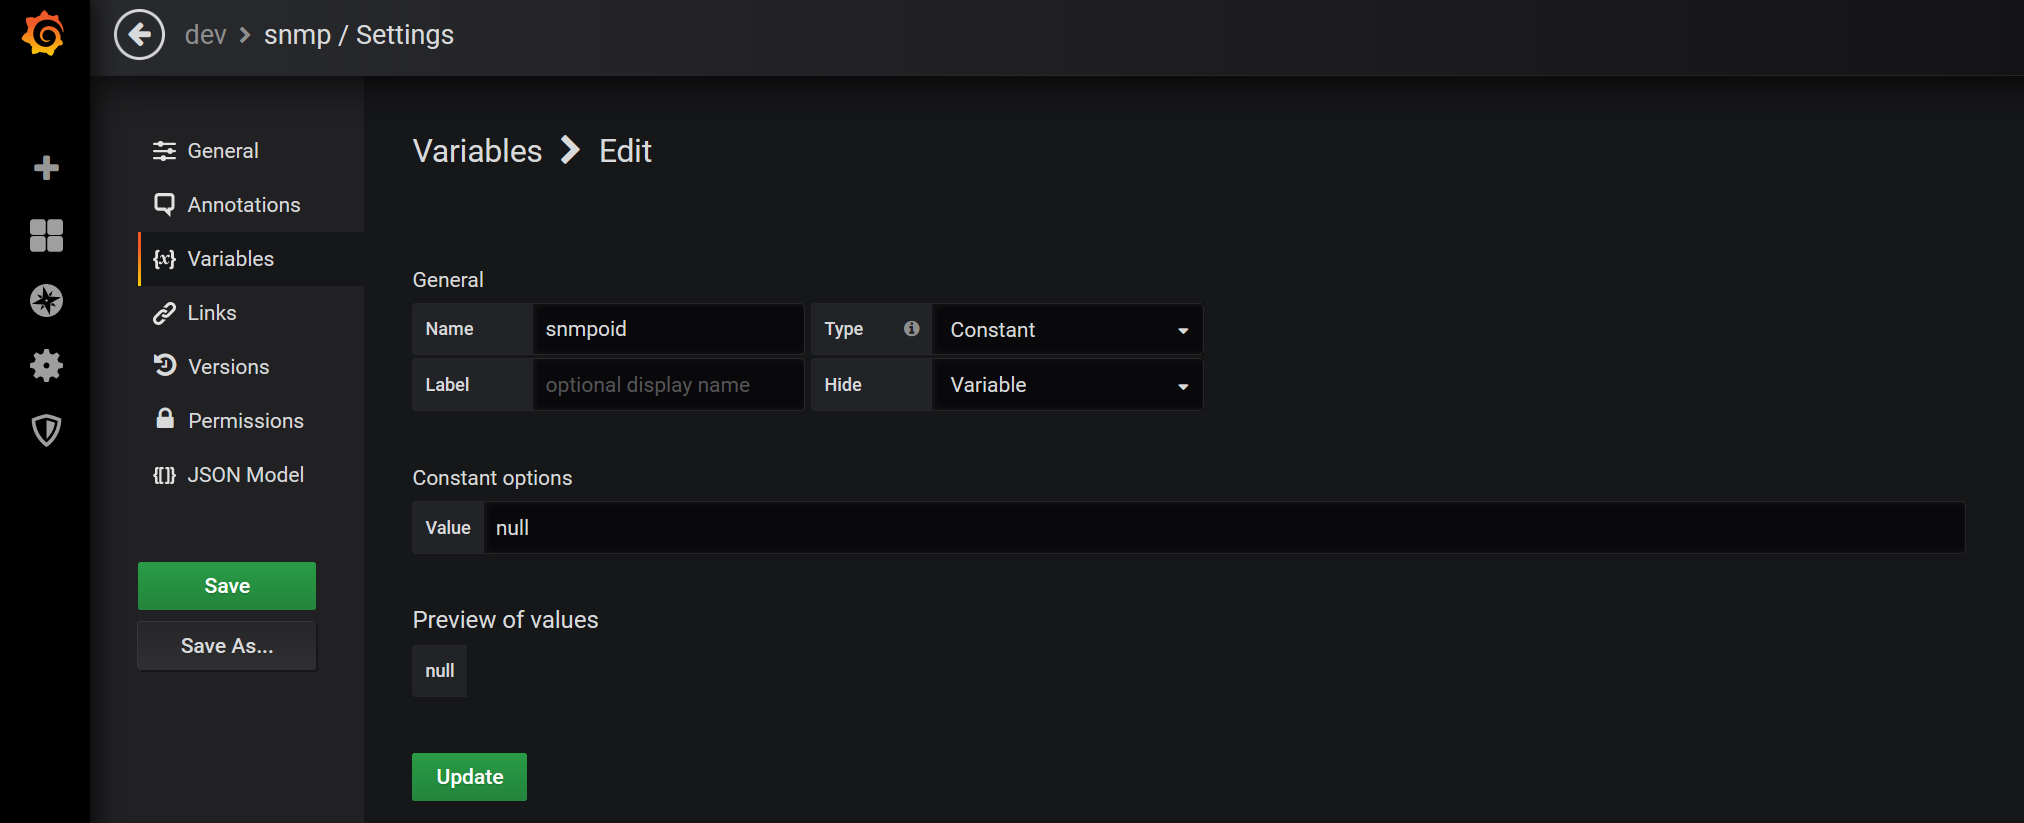
All the variables configured the same way, only name is different
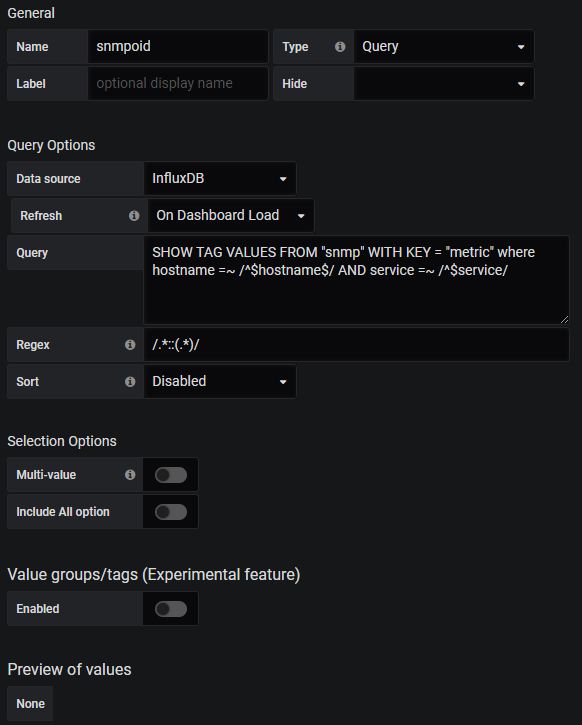
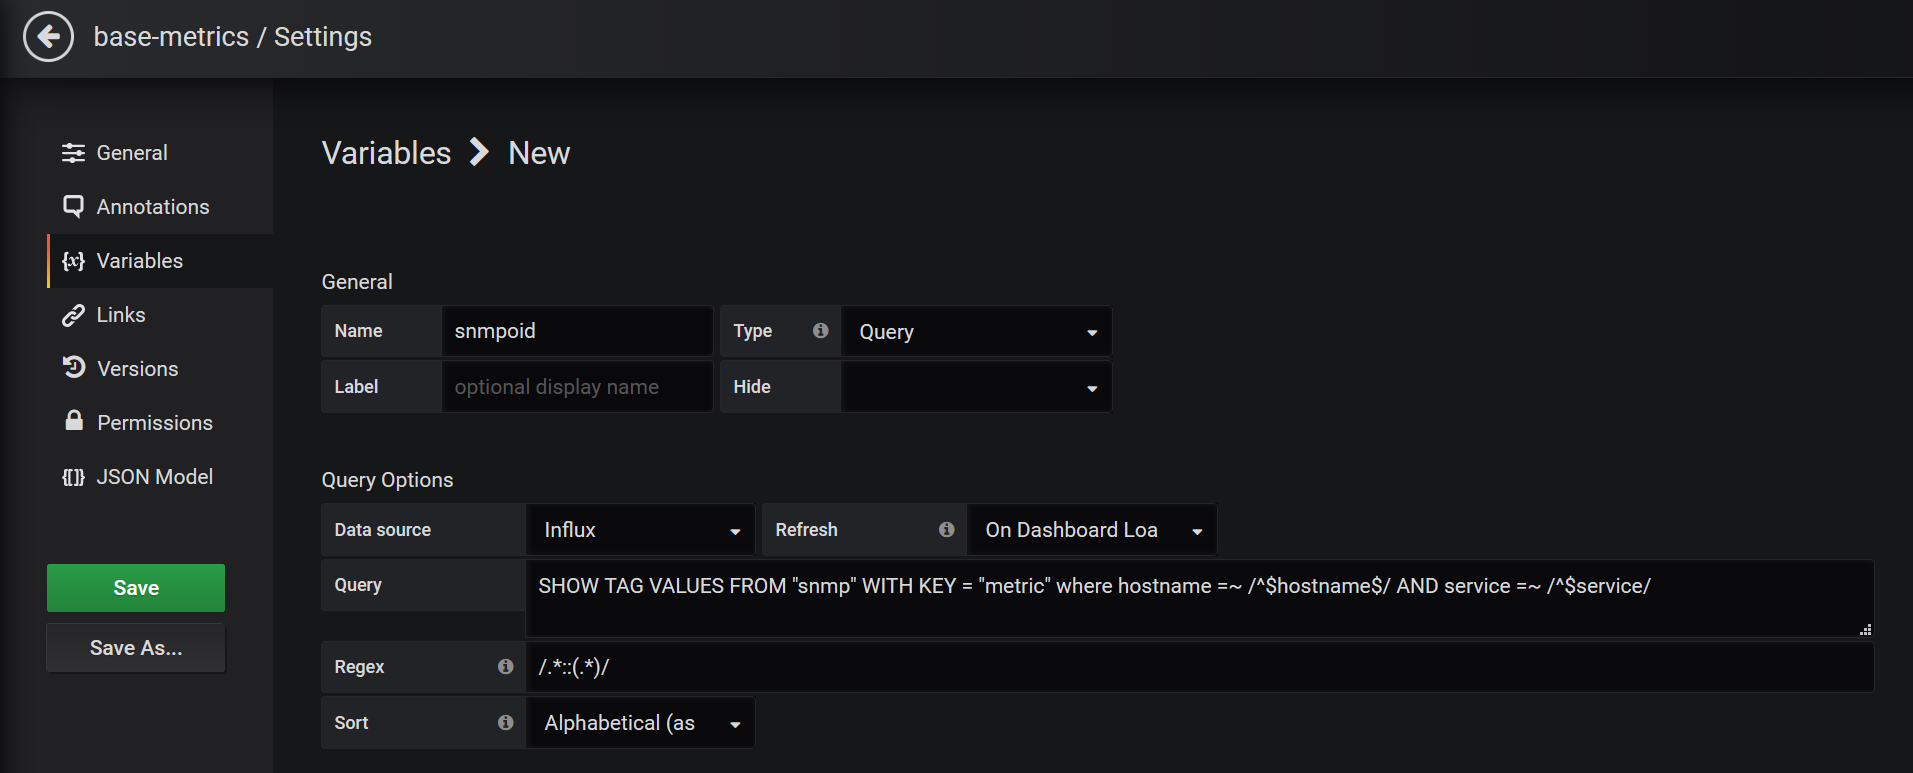
You query for the panel is
SELECT mean("value") FROM /^snmp$/ WHERE ("hostname" =~ /^$hostname$/ AND "service" =~ /^$service$/ AND "metric" =~ /.*$snmpoid.*/ ) AND $timeFilter GROUP BY time($__interval), "metric" fill(none)
If you want to be able to have a variable queried from influxdb it could look like this one (remove the regex part if it is not working for you)
Regards,
Carsten
it still errors
#0 /usr/share/icingaweb2/modules/grafana/library/Grafana/ProvidedHook/Grapher.php(538): Icinga\Application\ApplicationBootstrap->Icinga\Application\{closure}(Integer, String, String, Integer, Array)
#1 zend.view:///usr/share/icingaweb2/modules/monitoring/application/views/scripts/show/components/grapher.phtml(3): Icinga\Module\Grafana\ProvidedHook\Grapher->getPreviewHtml(Object(Icinga\Module\Monitoring\Object\Service))
#2 /usr/share/php/Icinga/Web/View.php(262): include(String)
#3 /usr/share/icingaweb2/library/vendor/Zend/View/Abstract.php(877): Icinga\Web\View->_run(String)
#4 zend.view:///usr/share/icingaweb2/modules/monitoring/application/views/scripts/partials/object/detail-content.phtml(3): Zend_View_Abstract->render(NULL)
#5 /usr/share/php/Icinga/Web/View.php(262): include(String)
#6 /usr/share/icingaweb2/library/vendor/Zend/View/Abstract.php(877): Icinga\Web\View->_run(String)
#7 zend.view:///usr/share/icingaweb2/modules/monitoring/application/views/scripts/service/show.phtml(8): Zend_View_Abstract->render(NULL)
#8 /usr/share/php/Icinga/Web/View.php(262): include(String)
#9 /usr/share/icingaweb2/library/vendor/Zend/View/Abstract.php(877): Icinga\Web\View->_run(String)
#10 /usr/share/icingaweb2/library/vendor/Zend/Controller/Action/Helper/ViewRenderer.php(904): Zend_View_Abstract->render(NULL)
#11 /usr/share/icingaweb2/library/vendor/Zend/Controller/Action/Helper/ViewRenderer.php(925): Zend_Controller_Action_Helper_ViewRenderer->renderScript(String, NULL)
#12 /usr/share/icingaweb2/library/vendor/Zend/Controller/Action/Helper/ViewRenderer.php(964): Zend_Controller_Action_Helper_ViewRenderer->render()
#13 /usr/share/icingaweb2/library/vendor/Zend/Controller/Action/HelperBroker.php(272): Zend_Controller_Action_Helper_ViewRenderer->postDispatch()
#14 /usr/share/icingaweb2/library/vendor/Zend/Controller/Action.php(518): Zend_Controller_Action_HelperBroker->notifyPostDispatch()
#15 /usr/share/php/Icinga/Web/Controller/Dispatcher.php(76): Zend_Controller_Action->dispatch(String)
#16 /usr/share/icingaweb2/library/vendor/Zend/Controller/Front.php(937): Icinga\Web\Controller\Dispatcher->dispatch(Object(Icinga\Web\Request), Object(Icinga\Web\Response))
#17 /usr/share/php/Icinga/Application/Web.php(300): Zend_Controller_Front->dispatch(Object(Icinga\Web\Request), Object(Icinga\Web\Response))
#18 /usr/share/php/Icinga/Application/webrouter.php(99): Icinga\Application\Web->dispatch()
#19 /usr/share/icingaweb2/public/index.php(4): require_once(String)
#20 {main}
Then it takes some time, dont have any snmp services running here.
Is there any solution to this, if not I’m going to have to write off this product and go else where loosing weeks of work
There will be a solution. Iam under heavy workload for my customers, so it takes some time to create services with snmp and fix the module if needed. If you want it solved faster, you can hire me, see www.ckc-it.de
Regards,
Carsten
1 Like
Pretty harsh tone for using open source software. While your frustration is understandable, please hide it here. @anon66228339 has done way more to help you in his spare time than the average answer in this community. Appreciate that.
Cheers,
Michael
1 Like
Understood. But I’m left with a build that’s not able to show interface usage for a network device and after weeks of work. Surely that’s one of the expected pieces of functionality.
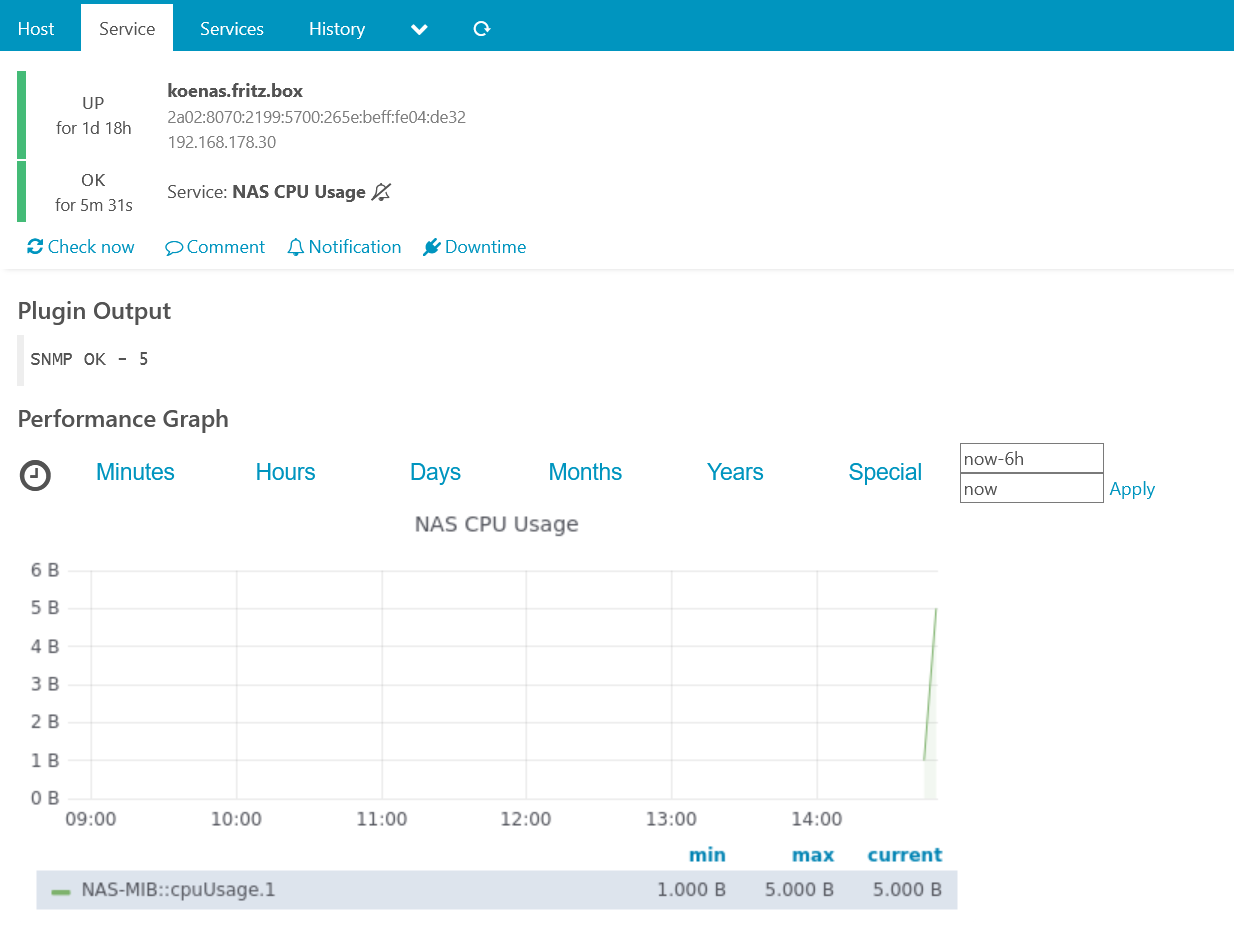
For me it works perfect, given service
object Service "NAS CPU Usage" {
  import "generic-service"

  host_name = "koenas.fritz.box"
  check_command = "snmp"

  enable_notifications = false

  vars.snmp_miblist = "NAS-MIB"
  vars.snmp_oid = "cpuUsage.1"

  vars.snmp_version = "2c"
}
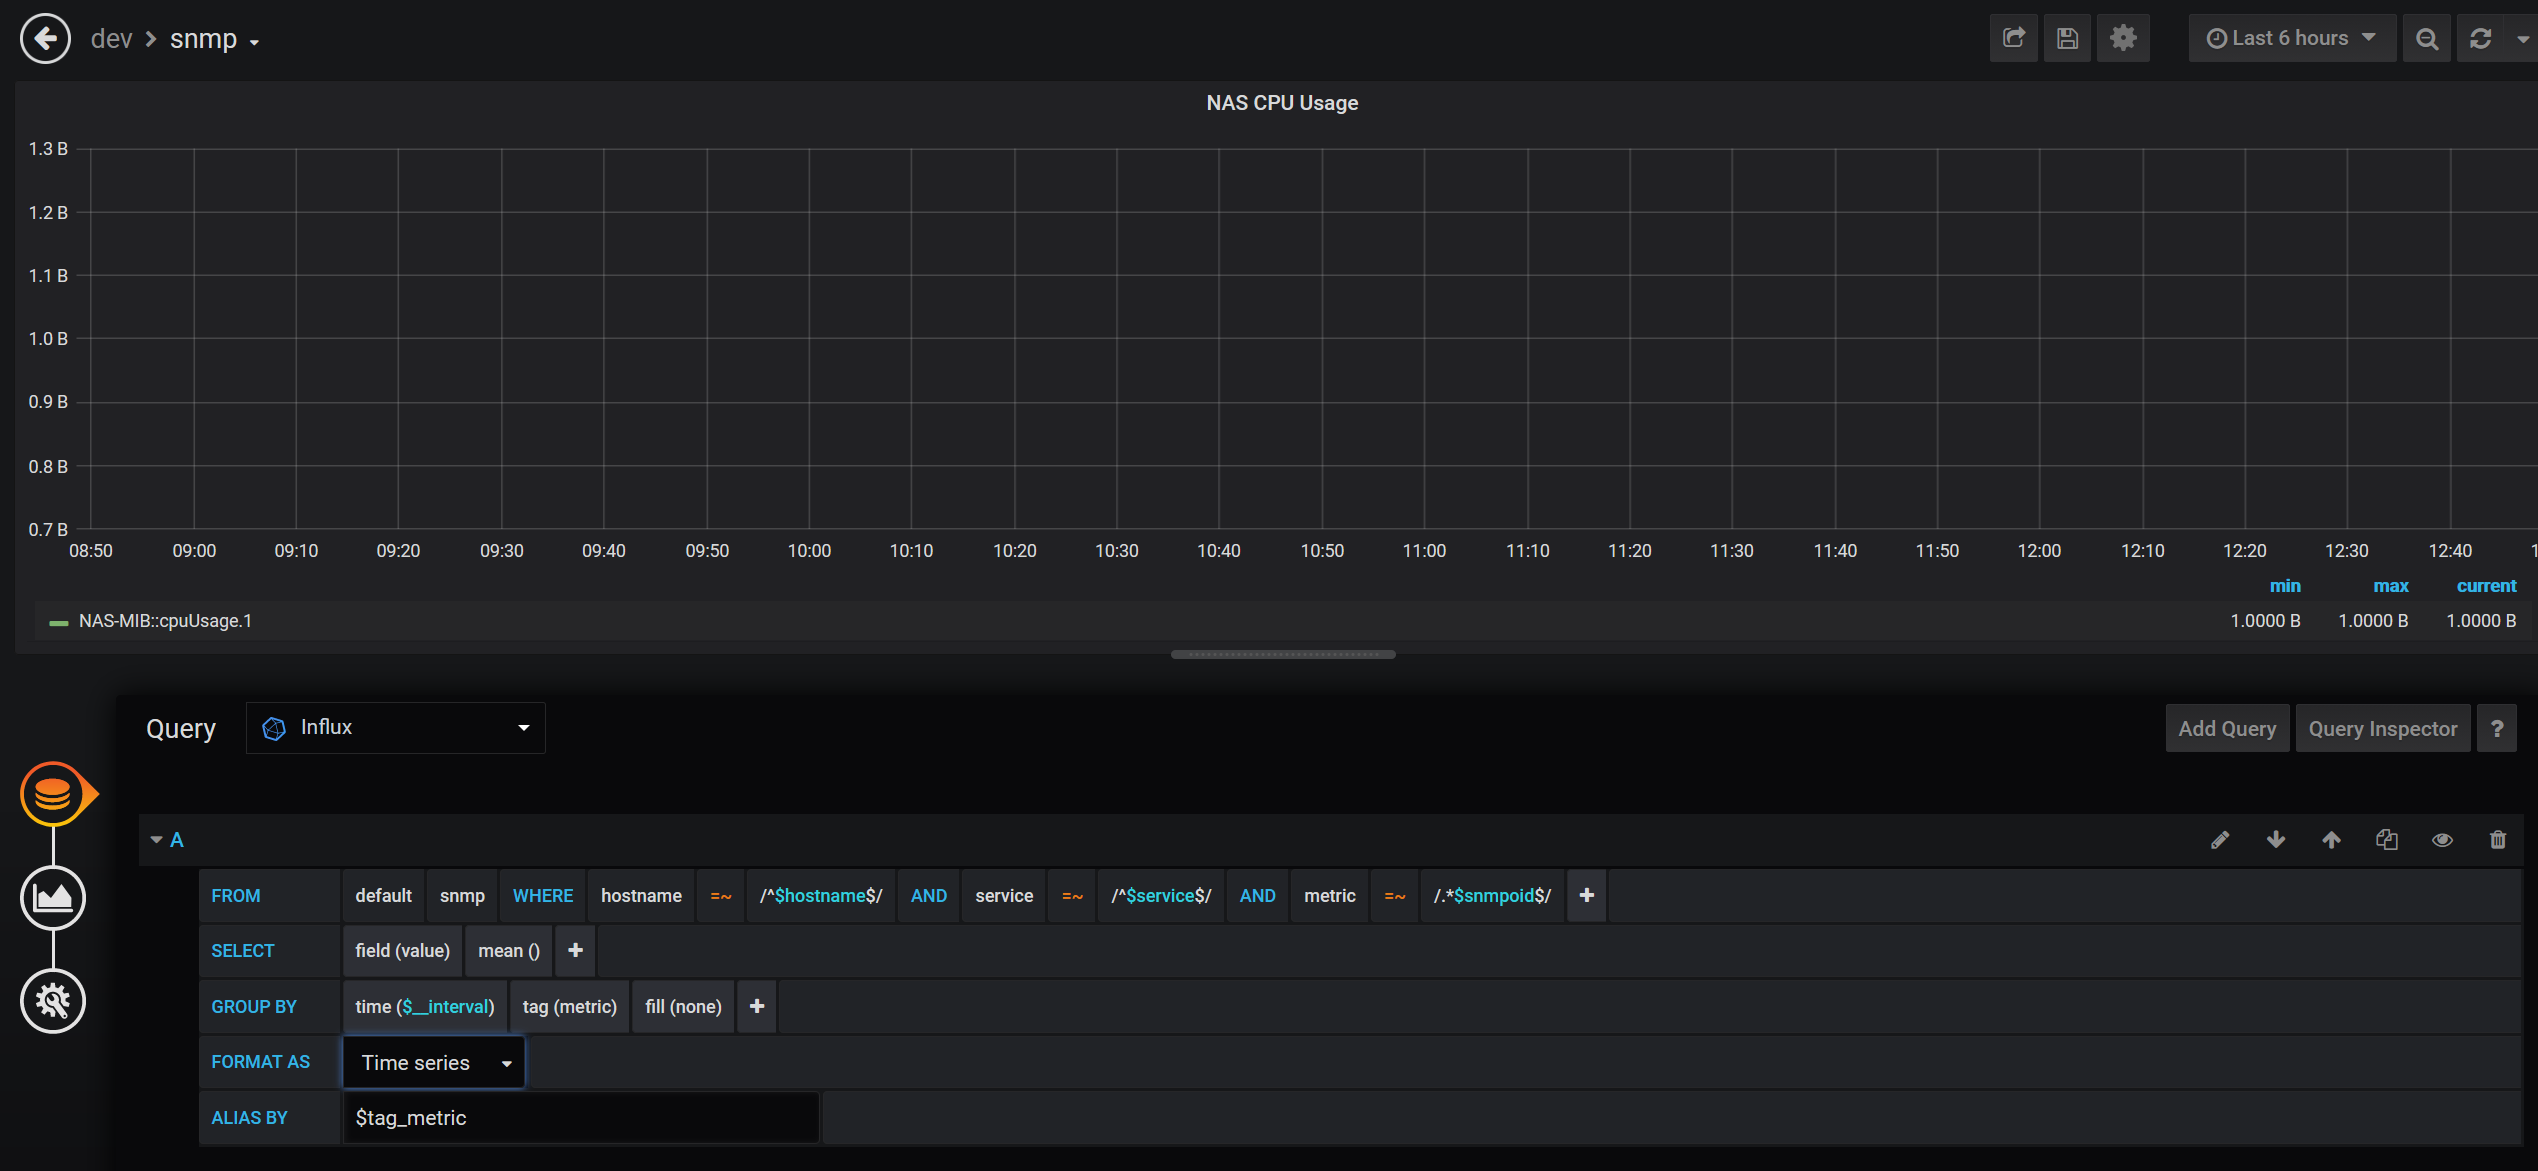
Shows in the webinterface
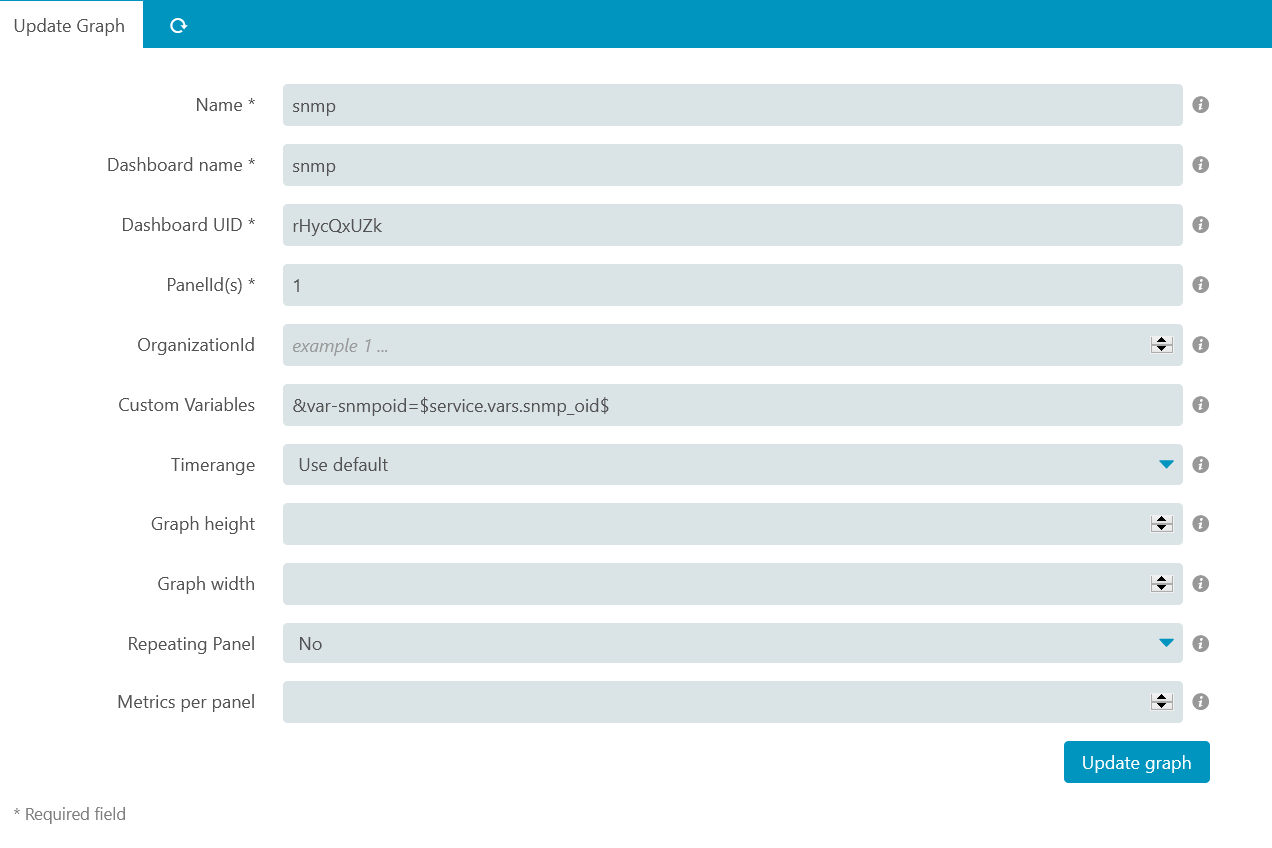
The Graph configuration:
The Dashboard:
Dashboard json: snmp-1581342756691.zip (1.8 KB)
I dont know why you get an php error, something must be really bad configured or installed.
For future assistance we need to know how you installed os, icingaweb, php, grafana etc. and the version you have installed.
Regards,
Carsten
2 Likes
Unfortunately tyour solution doesnt work, it still errors. But please note other embedded Grafana graphs do work. So I don’t think there is much wrong with my installation.
I’ve read through your JSON, it appears to be using constants for the hostname, and servicename. Constants here are not scalable. For instance each of my switch interfaces on each of the switches appear as a separate service name. Replicating the solution in this manner is simply not practical. It would be a nightmare
I’m still bemused how a Nagios fork is in this position.
Hi,
I’ll recommend changing your tone, this isn’t appropriate in this community.
If you still feel the need to request things, and not even say “thank you, @anon66228339, for guiding me so long”, I’d say you’d better get a paid enterprise support contract where you can demand things being done.
Or you’ll follow along the community guidelines and take the last chance to convince @anon66228339 and others to help you, for the fun and pride.
Regards,
Michael
Please my other posts I’ve said thank you plenty of times.
This is basic functionality that seems to be missing and having now spend over a month on Icinga trying to get it work it is exhausting. Sorry if my tone isn’t satisfactory for you.
@ctrmint if you think Icinga2 is a N***** fork you should read the complete story before you tell others about. If you dont like it, you are free to chose other monitoring solutions.
I use constants in my Grafana dashboards to speed up the rendering for icingaweb2. Each variable that is a query in your Grafana dashboard, takes time to do the query. For the use with my module its not needed, because the module sents all the needed variables and their values to Grafana for rendering. So its (alot) faster to use constants.
I show you how i configured it and it is working, you still didnt show us your complete configuration / dashboard json, so how should we help you any further?
1 Like
My concern is we are working towards a solution which isn’t dynamic, that is my complaint, but it seems that comment is being glossed over. Using Grafana to plot OS metrics is fine, and works easily. But scaling the same solution to fit a large number of switches/ports doesn’t seem practical given the proposed solution. Unfortunately I have spent too much time on this quit, i don’t have an option to move elsewhere, I’m over 140hrs.
My dashboard, at present is the following, though it is constantly changing as I’m trying to find a solution.
{
  "annotations": {
    "list": [
      {
        "builtIn": 1,
        "datasource": "-- Grafana --",
        "enable": true,
        "hide": true,
        "iconColor": "rgba(0, 211, 255, 1)",
        "name": "Annotations & Alerts",
        "type": "dashboard"
      }
    ]
  },
  "editable": true,
  "gnetId": null,
  "graphTooltip": 0,
  "id": 15,
  "iteration": 1581421523985,
  "links": [],
  "panels": [
    {
      "aliasColors": {},
      "bars": false,
      "dashLength": 10,
      "dashes": false,
      "datasource": "InfluxDB",
      "fill": 0,
      "fillGradient": 0,
      "gridPos": {
        "h": 11,
        "w": 24,
        "x": 0,
        "y": 0
      },
      "hiddenSeries": false,
      "id": 2,
      "interval": "",
      "legend": {
        "alignAsTable": true,
        "avg": true,
        "current": true,
        "max": true,
        "min": true,
        "show": true,
        "total": false,
        "values": true
      },
      "lines": true,
      "linewidth": 1,
      "nullPointMode": "null",
      "options": {
        "dataLinks": []
      },
      "percentage": false,
      "pointradius": 2,
      "points": false,
      "renderer": "flot",
      "seriesOverrides": [
        {
          "alias": "$snmpoid",
          "color": "rgb(0, 255, 9)",
          "fill": 1,
          "fillGradient": 5
        },
        {
          "alias": "Average (1m)",
          "color": "rgb(255, 246, 0)",
          "fill": 0,
          "linewidth": 1
        }
      ],
      "spaceLength": 10,
      "stack": false,
      "steppedLine": false,
      "targets": [
        {
          "alias": "$snmpoid",
          "groupBy": [
            {
              "params": [
                "$__interval"
              ],
              "type": "time"
            },
            {
              "params": [
                "null"
              ],
              "type": "fill"
            }
          ],
          "orderByTime": "ASC",
          "policy": "default",
          "query": "SELECT mean(\"value\") FROM /^snmp$/ WHERE (\"hostname\" =~ /^$hostname$/ AND \"service\" =~ /^$service$/ AND \"metric\" =~ /.*$snmpoid.*/ ) AND $timeFilter GROUP BY time($__interval), \"metric\" fill(none)",
          "rawQuery": true,
          "refId": "A",
          "resultFormat": "time_series",
          "select": [
            [
              {
                "params": [
                  "value"
                ],
                "type": "field"
              },
              {
                "params": [],
                "type": "mean"
              }
            ]
          ],
          "tags": []
        }
      ],
      "thresholds": [],
      "timeFrom": null,
      "timeRegions": [],
      "timeShift": null,
      "title": "$service",
      "tooltip": {
        "shared": true,
        "sort": 0,
        "value_type": "individual"
      },
      "transparent": true,
      "type": "graph",
      "xaxis": {
        "buckets": null,
        "mode": "time",
        "name": null,
        "show": true,
        "values": []
      },
      "yaxes": [
        {
          "format": "short",
          "label": null,
          "logBase": 1,
          "max": null,
          "min": null,
          "show": true
        },
        {
          "format": "short",
          "label": null,
          "logBase": 1,
          "max": null,
          "min": null,
          "show": true
        }
      ],
      "yaxis": {
        "align": false,
        "alignLevel": null
      }
    }
  ],
  "refresh": false,
  "schemaVersion": 22,
  "style": "dark",
  "tags": [],
  "templating": {
    "list": [
      {
        "current": {
          "selected": false,
          "text": "hostname.fqdn.com",
          "value": "hostname.fqdn.com"
        },
        "hide": 2,
        "label": null,
        "name": "hostname",
        "options": [
          {
            "selected": true,
            "text": "hostname.fqdn.com",
            "value": "hostname.fqdn.com"
          }
        ],
        "query": "hostname.fqdn.com",
        "skipUrlSync": false,
        "type": "constant"
      },
      {
        "current": {
          "selected": false,
          "text": "Fg Cpu Usage",
          "value": "Fg Cpu Usage"
        },
        "hide": 2,
        "label": null,
        "name": "service",
        "options": [
          {
            "selected": true,
            "text": "Fg Cpu Usage",
            "value": "Fg Cpu Usage"
          }
        ],
        "query": "Fg Cpu Usage",
        "skipUrlSync": false,
        "type": "constant"
      },
      {
        "allValue": null,
        "current": {
          "tags": [],
          "text": "fgSysCpuUsage.0",
          "value": "fgSysCpuUsage.0"
        },
        "datasource": "InfluxDB",
        "definition": "SHOW TAG VALUES FROM \"snmp\" WITH KEY = \"metric\" where hostname =~ /^$hostname$/ AND service =~ /^$service/",
        "hide": 0,
        "includeAll": false,
        "label": null,
        "multi": false,
        "name": "snmpoid",
        "options": [],
        "query": "SHOW TAG VALUES FROM \"snmp\" WITH KEY = \"metric\" where hostname =~ /^$hostname$/ AND service =~ /^$service/",
        "refresh": 1,
        "regex": "/.*::(.*)/",
        "skipUrlSync": false,
        "sort": 0,
        "tagValuesQuery": "",
        "tags": [],
        "tagsQuery": "",
        "type": "query",
        "useTags": false
      },
      {
        "current": {
          "selected": false,
          "text": "snmp",
          "value": "snmp"
        },
        "hide": 2,
        "label": null,
        "name": "command",
        "options": [
          {
            "selected": true,
            "text": "snmp",
            "value": "snmp"
          }
        ],
        "query": "snmp",
        "skipUrlSync": false,
        "type": "constant"
      }
    ]
  },
  "time": {
    "from": "now-1h",
    "to": "now"
  },
  "timepicker": {
    "refresh_intervals": [
      "5s",
      "10s",
      "30s",
      "1m",
      "5m",
      "15m",
      "30m",
      "1h",
      "2h",
      "1d"
    ]
  },
  "timezone": "",
  "title": "fortigate-base",
  "uid": "Tt0U1T8Wk",
  "version": 36
}
Quickly checked your dashboard. If you use constants enter null, make snmpoid also a constant, the rest should be fine.
What i totaly forgot to ask, which version on the grafana-module you use?