SNMP Check var-service Grafana variable

Hi Again!

I’ve been going through and building my Grafana dashboards for all Windows checks, that’s going OK and I think I’ve got my head around how it works.

I’ve now moved to building Grafana dashboards and setting them up in Icinga for a number of network devices. First up some Fortinet devices, but I’ve quickly hit an issue with SNMP checks

It would appear my SNMP check var-service variable sent from Icinga does not contain the name of the mib as a result the Grafana chart isn’t pulled properly. I’ve turned debug on and copied the URL into my browser, replaced the var-service for the full correct path (mib+OID) and it works. I can’t seem to successfully replace var-service with a concatenation of the SNMP MID and OID. Hope that makes. sense.

The current request coming from Icinga is as follows, which does not work.

http://x.x.x.x:3000/render/dashboard-solo/db/fortigate-base?var-hostname=fortigate.x.x.x&var-service=Fg%20Cpu%20Usage%20%25&var-command=snmp&panelId=2&orgId=1&width=600&height=300&theme=dark&from=now-2d&to=now

This however does work

http://x.x.x.x:3000/render/dashboard-solo/db/fortigate-base?var-hostname=fortigate.x.x.x&var-service=FORTINET-FORTIGATE-MIB::fgSysCpuUsage.0&var-command=snmp&panelId=2

As can be seen the change is var-service=FORTINET-FORTIGATE-MIB::fgSysCpuUsage.0
Using the Grafana UI it works obviously.

The bad value from the non working request was, Fg Cpu Usage %

I’ve tried using the custom var attribute to change the field but with no success.

The original check is

template Service "Fg Cpu Usage %" {
    import "SNMP v1  Fortigate"

    check_command = "snmp"
    enable_perfdata = true
    groups = [ "SNMP Checks" ]
    command_endpoint = null
    vars.snmp_community = "mystringyoucantsee"
    vars.snmp_miblist = "FORTINET-FORTIGATE-MIB"
    vars.snmp_oid = "fgSysCpuUsage.0"
    vars.snmp_version = "1"
}

My Grafana query is as follows;
SELECT distinct("value") FROM "snmp" WHERE ("hostname" =~ /^$hostname$/ AND "metric" =~ /^$service$/) AND $timeFilter GROUP BY time($__interval) fill(null)

I hope I am just being stupid. The Windows checks seemed more obvious.

This is the common error I get, which occurs when I attempt to use the custom var on the Grafana graph configuration in Icinga.

Undefined variable: dataSource

#0 /usr/share/icingaweb2/modules/grafana/library/Grafana/ProvidedHook/Grapher.php(538): Icinga\Application\ApplicationBootstrap->Icinga\Application\{closure}(Integer, String, String, Integer, Array)
#1 zend.view:///usr/share/icingaweb2/modules/monitoring/application/views/scripts/show/components/grapher.phtml(3): Icinga\Module\Grafana\ProvidedHook\Grapher->getPreviewHtml(Object(Icinga\Module\Monitoring\Object\Service))
#2 /usr/share/php/Icinga/Web/View.php(262): include(String)
#3 /usr/share/icingaweb2/library/vendor/Zend/View/Abstract.php(877): Icinga\Web\View->_run(String)
#4 zend.view:///usr/share/icingaweb2/modules/monitoring/application/views/scripts/partials/object/detail-content.phtml(3): Zend_View_Abstract->render(NULL)
#5 /usr/share/php/Icinga/Web/View.php(262): include(String)
#6 /usr/share/icingaweb2/library/vendor/Zend/View/Abstract.php(877): Icinga\Web\View->_run(String)
#7 zend.view:///usr/share/icingaweb2/modules/monitoring/application/views/scripts/service/show.phtml(8): Zend_View_Abstract->render(NULL)
#8 /usr/share/php/Icinga/Web/View.php(262): include(String)
#9 /usr/share/icingaweb2/library/vendor/Zend/View/Abstract.php(877): Icinga\Web\View->_run(String)
#10 /usr/share/icingaweb2/library/vendor/Zend/Controller/Action/Helper/ViewRenderer.php(904): Zend_View_Abstract->render(NULL)
#11 /usr/share/icingaweb2/library/vendor/Zend/Controller/Action/Helper/ViewRenderer.php(925): Zend_Controller_Action_Helper_ViewRenderer->renderScript(String, NULL)
#12 /usr/share/icingaweb2/library/vendor/Zend/Controller/Action/Helper/ViewRenderer.php(964): Zend_Controller_Action_Helper_ViewRenderer->render()
#13 /usr/share/icingaweb2/library/vendor/Zend/Controller/Action/HelperBroker.php(272): Zend_Controller_Action_Helper_ViewRenderer->postDispatch()
#14 /usr/share/icingaweb2/library/vendor/Zend/Controller/Action.php(518): Zend_Controller_Action_HelperBroker->notifyPostDispatch()
#15 /usr/share/php/Icinga/Web/Controller/Dispatcher.php(76): Zend_Controller_Action->dispatch(String)
#16 /usr/share/icingaweb2/library/vendor/Zend/Controller/Front.php(937): Icinga\Web\Controller\Dispatcher->dispatch(Object(Icinga\Web\Request), Object(Icinga\Web\Response))
#17 /usr/share/php/Icinga/Application/Web.php(300): Zend_Controller_Front->dispatch(Object(Icinga\Web\Request), Object(Icinga\Web\Response))
#18 /usr/share/php/Icinga/Application/webrouter.php(99): Icinga\Application\Web->dispatch()
#19 /usr/share/icingaweb2/public/index.php(4): require_once(String)
#20 {main}

The only way I can currently force the var-service to be configured appropriately in the icinga Grafana request URL is to change the name of the check to the same as the SNMP MIB and OID.

So my check becomes;

## zones.d/director-global/service_templates.conf
template Service "FORTINET-FORTIGATE-MIB::fgSysCpuUsage.0" {
      import "SNMP v1 Fortigate"

      check_command = "[snmp]" 
      enable_perfdata = true 
      groups = [ "SNMP Checks" ] 
      command_endpoint = null 
      vars.snmp_community = "public" 
      vars.snmp_miblist = "FORTINET-FORTIGATE-MIB" 
      vars.snmp_oid = "fgSysCpuUsage.0" 
      vars.snmp_version = "1"

This works, and the graph from Grafana appears in Icinga. But that’s not a scalable solution, I’d need a check for every interface and check type along with corresponding graph. I can’t believe there is no simple solution to this.

Can anyone help please?

is there anyone that could assist? I’m really stuck on this one.

First of all please post the versions you use of Grafana and the module. Which backend are you using? How does the output of the plugin looks like on the commandline?

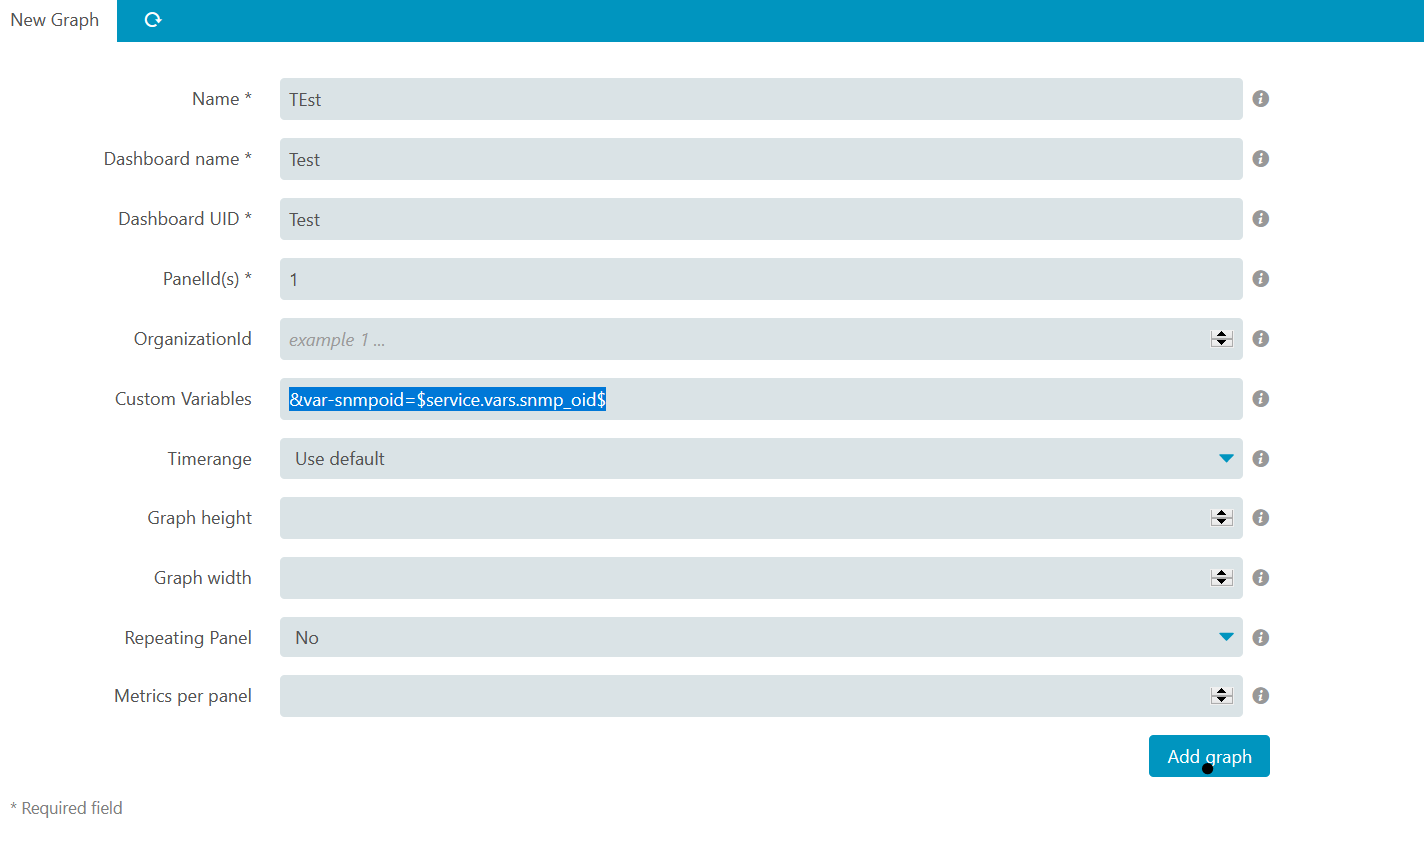
Did you try to set the custom var for the dashboard configuration to $service.vars.snmp.oid and use this in your dashboard to select the metrics?

The query would like like

SELECT distinct("value") FROM "snmp" WHERE ("hostname" =~ /^$hostname$/ AND "service" =~ /^$service$/) AND "metric" ~= /$snmpoid*/ AND $timeFilter GROUP BY time($__interval) fill(null)

Regards,
Carsten

1 Like

I’m using Grafana module 1.3.5 with Influxdb.
Grafana is v6.6.0

The command line looks like the following;
/usr/lib/nagios/plugins/check_snmp -C community_string -H x.x.x.x -P 1 -m FORTINET-FORTIGATE-MIB -o fgSysCpuUsage.0 -t 10

The command line output is as follows;

SNMP OK - 11 | FORTINET-FORTIGATE-MIB::fgSysCpuUsage.0=11

Hi,

then the query part must be modified to "metric" ~= /*$snmpoid*/
Dont forget to add a constant snmpoid to your dashboard in Grafana.

1 Like

do I need a grafana variable for $snmpoid

Yes you need to add it. :slight_smile:

could you indicate what it should be ? I’m not great at writing the SQL needed

I’m a little confused as I’ve got the following variables in Grafana.

hostname
SHOW TAG VALUES WITH KEY = "hostname"
returns hostnames as expected

Service
SHOW TAG VALUES FROM "snmp" WITH KEY = "metric" where hostname =~ /^$hostname$/

That returns for example FORTINET-FORTIGATE-MIB::fgSysCpuUsage.0
It doesn’t return just the MIB name, is that correct? Should it just return the MIB name ???

I’ve changed my service variable to
SHOW TAG VALUES FROM "snmp" WITH KEY ="service" where hostname =~ /^$hostname$/

but struggling with the metric variable

Just add snmpoid as a constant

sorry can you be more specific? I’m trying to understand the process, but I’m not sure if you are refering to Icinga or Grafana or both?

I think I’ve followed your advice and improved the Grafana side,
my snmpoid variable in Grafana is now
SHOW TAG VALUES FROM "snmp" WITH KEY = "metric" where hostname =~ /^$hostname$/ AND service =~ /^$service/

My request URL now looks like the following, which includes the correct service name, such as Fg Cpu Usage the snmpoid also reflects the service.

fortigate-base?orgId=1&from=now-5m&to=now&var-hostname=fqdn.com&var-service=Fg%20Cpu%20Usage&var-snmpoid=FORTINET-FORTIGATE-MIB::fgSysCpuUsage.0

Unfortunately it still appears Icinga is trying to send an incorrect snmpoid value

Set it to constant not a query

Please show your graph configuration.

i’m sorry i still not following.
I’m trying to make this something dynamic so it can be used on many devices and queries.

I’m surprised I can’t graph an SNMP MIB OID with ease, it kinda negates the entire product.
There must be something amiss with the configuration.

you cant do that for the OID, because its stored in metric.

The Output from your snmp plugin is SNMP OK - 11 | FORTINET-FORTIGATE-MIB::fgSysCpuUsage.0=11

so the metric inside influxdb is FORTINET-FORTIGATE-MIB::fgSysCpuUsage.0

With the module you can set to use a custom var from your service to call the Grafana API where you can use it as a variable in your dashboard. If you use the oid from your service, the module will send the string “fgSysCpuUsage.0” to the API and you can use this variable. I dont recomend to use variables inside Grafana with queries, they slow down everything. Use only Constants for use with the module and a second dasboard with queries to fill the variables to play inside Grafana.

With the variable you can then set your queris to use values only from snmp with the hostname , servicename and the metrics that contain “fgSysCpuUsage.0”

1 Like

I’ve got hundreds of interfaces all sending the data in the same, what you are saying is I have to do that for each interface. That isn’t scalable.