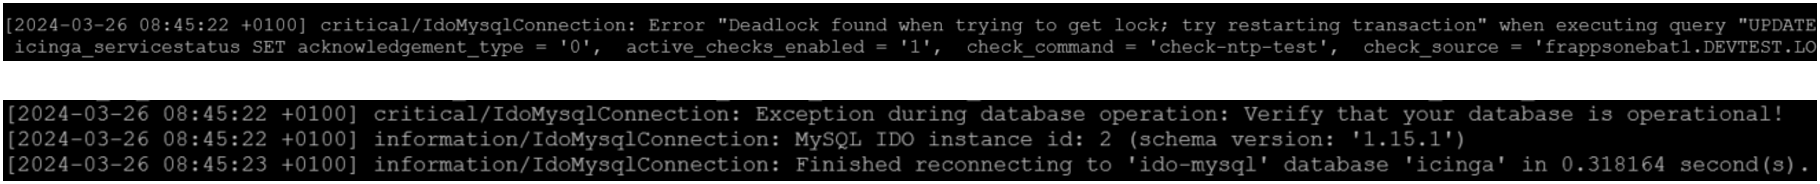
We are using Icinga (with icinga director) and we’re encountering occasional server crashes due to out-of-memory issues. In the logs we’ve observed several occurrences:
Memory consumption starts to increase when Icinga is repeatedly restarted by the watchdog:
Hard to say, but yes, I would guess, too, that the deadlocks are the reason for you problem.
Since this happens in a Database query, could you please investigate whether your galera cluster is having problems?
Thanks for coming forward with your issue. I have moved this thread from the Icinga DB category to Icinga Director, as Icinga DB is not used here.
Could you please post your logs again, maybe as plain text as the first screenshot has a very low resolution and is hard to read.
How do you access the database nodes within your Galera cluster? Is it round robin or always the same node for everyone? Is a load balancer in place?
If I’m deciphering the first screenshot correctly, it’s the Icinga Director which gets aborted due to an exceeded watchdog timeout. Could you please supply additional logs from the Director?
Furthermore, you wrote about OOM issues. Does the OOM killer performs any actions? How does your setup look like and, more important, when do the issues started and did you perform any changes around that time?
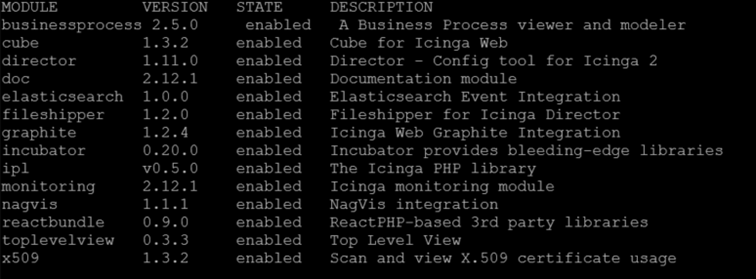
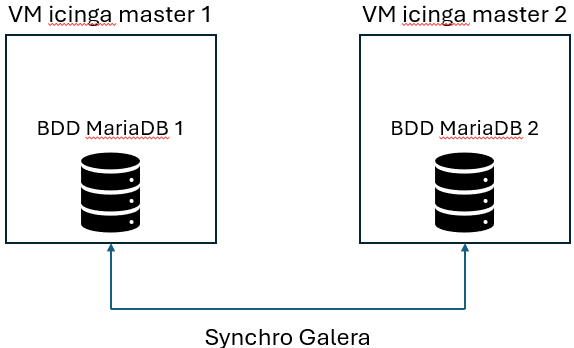
Thank you for your assistance. Here is our configuration regarding Icinga and Mariadb. Each Master has its own database, wich is synchronised by galera :
I am unable to identify when the problem began because we have just discovered that deadlocks are occuring across all our environments and nothing change since few months (fewer occurences because of fewer activity ?).
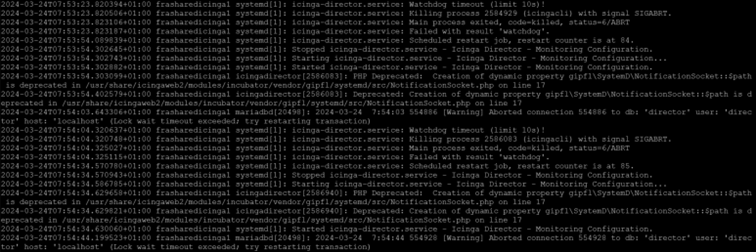
Here is the syslog in plain text when watchlog start to kiil icinga :
2024-03-24T07:00:04.820374+01:00 frasharedicinga1 systemd[1]: icinga-director.service: Watchdog timeout (limit 10s)!
2024-03-24T07:00:04.820617+01:00 frasharedicinga1 systemd[1]: icinga-director.service: Killing process 137021 (icingacli) with signal SIGABRT.
2024-03-24T07:00:04.822500+01:00 frasharedicinga1 systemd[1]: icinga-director.service: Main process exited, code=killed, status=6/ABRT
2024-03-24T07:00:04.822576+01:00 frasharedicinga1 systemd[1]: icinga-director.service: Failed with result ‘watchdog’.
2024-03-24T07:00:04.822901+01:00 frasharedicinga1 systemd[1]: icinga-director.service: Consumed 13.578s CPU time.
2024-03-24T07:00:35.070737+01:00 frasharedicinga1 systemd[1]: icinga-director.service: Scheduled restart job, restart counter is at 5.
2024-03-24T07:00:35.070981+01:00 frasharedicinga1 systemd[1]: Stopped icinga-director.service - Icinga Director - Monitoring Configuration.
2024-03-24T07:00:35.071050+01:00 frasharedicinga1 systemd[1]: icinga-director.service: Consumed 13.578s CPU time.
2024-03-24T07:00:35.086319+01:00 frasharedicinga1 systemd[1]: Starting icinga-director.service - Icinga Director - Monitoring Configuration…
2024-03-24T07:00:35.128421+01:00 frasharedicinga1 icingadirector[2504565]: PHP Deprecated: Creation of dynamic property gipfl\SystemD\NotificationSocket::$path is deprecated in /usr/share/icingaweb2/modules/incubator/vendor/gipfl/systemd/src/NotificationSocket.php on line 17
2024-03-24T07:00:35.141534+01:00 frasharedicinga1 icingadirector[2504565]: Deprecated: Creation of dynamic property gipfl\SystemD\NotificationSocket::$path is deprecated in /usr/share/icingaweb2/modules/incubator/vendor/gipfl/systemd/src/NotificationSocket.php on line 17
2024-03-24T07:00:35.141581+01:00 frasharedicinga1 systemd[1]: Started icinga-director.service - Icinga Director - Monitoring Configuration.
2024-03-24T07:00:45.320644+01:00 frasharedicinga1 systemd[1]: icinga-director.service: Watchdog timeout (limit 10s)!
2024-03-24T07:00:45.320736+01:00 frasharedicinga1 systemd[1]: icinga-director.service: Killing process 2504565 (icingacli) with signal SIGABRT.
2024-03-24T07:00:45.322442+01:00 frasharedicinga1 systemd[1]: icinga-director.service: Main process exited, code=killed, status=6/ABRT
2024-03-24T07:00:45.322515+01:00 frasharedicinga1 systemd[1]: icinga-director.service: Failed with result ‘watchdog’.
2024-03-24T07:01:15.570738+01:00 frasharedicinga1 systemd[1]: icinga-director.service: Scheduled restart job, restart counter is at 6.
2024-03-24T07:01:15.570892+01:00 frasharedicinga1 systemd[1]: Stopped icinga-director.service - Icinga Director - Monitoring Configuration.
2024-03-24T07:01:15.610965+01:00 frasharedicinga1 systemd[1]: Starting icinga-director.service - Icinga Director - Monitoring Configuration…
2024-03-24T07:01:15.667573+01:00 frasharedicinga1 icingadirector[2505664]: PHP Deprecated: Creation of dynamic property gipfl\SystemD\NotificationSocket::$path is deprecated in /usr/share/icingaweb2/modules/incubator/vendor/gipfl/systemd/src/NotificationSocket.php on line 17
2024-03-24T07:01:15.667695+01:00 frasharedicinga1 icingadirector[2505664]: Deprecated: Creation of dynamic property gipfl\SystemD\NotificationSocket::$path is deprecated in /usr/share/icingaweb2/modules/incubator/vendor/gipfl/systemd/src/NotificationSocket.php on line 17
Here is when the server crash :
2024-03-24T16:22:47.861899+01:00 frasharedicinga1 systemd[1]: icinga-director.service: Watchdog timeout (limit 10s)!
2024-03-24T16:22:47.964223+01:00 frasharedicinga1 systemd[1]: icinga-director.service: Killing process 3359110 (icingacli) with signal SIGABRT.
2024-03-24T16:22:47.965017+01:00 frasharedicinga1 systemd[1]: icinga-director.service: Main process exited, code=killed, status=6/ABRT
2024-03-24T16:22:47.966400+01:00 frasharedicinga1 systemd[1]: icinga-director.service: Failed with result ‘watchdog’.
2024-03-24T16:23:13.924993+01:00 frasharedicinga1 mariadbd[20498]: 2024-03-24 16:23:12 0 [Warning] WSREP: last inactive check more than PT1.5S ago (PT2.9058S), skipping check
2024-03-24T16:23:22.524284+01:00 frasharedicinga1 mariadbd[20498]: 2024-03-24 16:23:16 0 [Warning] WSREP: last inactive check more than PT1.5S ago (PT4.28955S), skipping check
2024-03-24T16:23:35.856260+01:00 frasharedicinga1 mariadbd[20498]: 2024-03-24 16:23:19 0 [Note] WSREP: (04ee230b-b12e, ‘tcp://0.0.0.0:4567’) connection to peer 2a068694-a710 with addr tcp://172.27.0.151:4567 timed out, no messages seen in PT3S, socket stats: rtt: 14629 rttvar: 19806 rto: 216000 lost: 0 last_data_recv: 408 cwnd: 10 last_queued_since: 537654121 last_delivered_since: 3054167349 send_queue_length: 7 send_queue_bytes: 484 segment: 0 messages: 7
2024-03-24T16:23:41.907588+01:00 frasharedicinga1 kernel: [460817.795459] systemd-journal invoked oom-killer: gfp_mask=0x140cca(GFP_HIGHUSER_MOVABLE|__GFP_COMP), order=0, oom_score_adj=-250
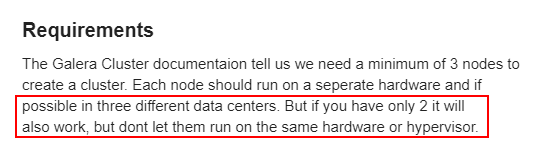
We have already seen this tutorial, and it says that we can have two nodes in the cluster if they run on different HV :
Our Icinga has been fine for a few years. We just have more and more VMs to monitor, and maybe we are reaching its limit with this configuration? (1650 services for 134 hosts)
Regardless of your database setup being more like a master-master than a cluster, the error might be related to Galera as there were some WSREP log messages in your earlier post:
2024-03-24T16:23:13.924993+01:00 frasharedicinga1 mariadbd[20498]: 2024-03-24 16:23:12 0 [Warning] WSREP: last inactive check more than PT1.5S ago (PT2.9058S), skipping check
2024-03-24T16:23:22.524284+01:00 frasharedicinga1 mariadbd[20498]: 2024-03-24 16:23:16 0 [Warning] WSREP: last inactive check more than PT1.5S ago (PT4.28955S), skipping check
2024-03-24T16:23:35.856260+01:00 frasharedicinga1 mariadbd[20498]: 2024-03-24 16:23:19 0 [Note] WSREP: (04ee230b-b12e, ‘tcp://0.0.0.0:4567’) connection to peer 2a068694-a710 with addr tcp://172.27.0.151:4567 timed out, no messages seen in PT3S, socket stats: rtt: 14629 rttvar: 19806 rto: 216000 lost: 0 last_data_recv: 408 cwnd: 10 last_queued_since: 537654121 last_delivered_since: 3054167349 send_queue_length: 7 send_queue_bytes: 484 segment: 0 messages: 7
Could you check your cluster’s health as it might be that there are issues, resulting in the icinga-director.service to crash.
Please be aware that a Galera Cluster cannot always be used as a direct drop in replacement for a MySQL. Take, for example, a look at wsrep_sync_wait.
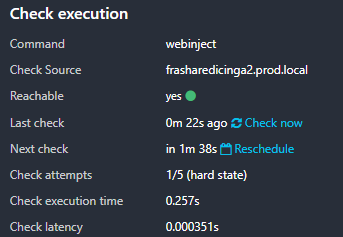
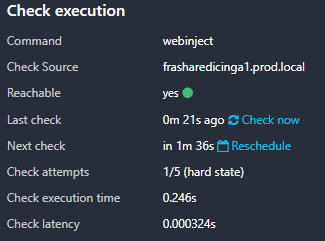
@apenning , We are monitoring wsrep_cluster_size and wsrep_flow_control_paused . I will add some other checks as you mentioned to see if there is anything unusual
@moreamazingnick , It’s a good question. I’m not familiar with Galera at the moment, but we are using it solely to synchronize databases between Icinga master1 and Icinga master2. Some checks are on master1 and others are on master2 :
If one of our nodes is down, all checks fail over to the other node.