I did automate the import of hosts (VMs) from our vSphere cluster into director, and I’m trying to set up a very tolerant check on a host template, that would only check that the VM is up and running.
I mean, they are cases where trying to ping it won’t be possible nor relevant, but I still need to know its power state.
In a host template, I’m using a custom check_command I’ve created (“command01”).
In the definition of this command, The “command” field is filled in with :
vmware-esx-soap-vm-runtime-powerstate --name
All this is not working, as this command seems to always tell me the host is powered on.
I really feel like I totally missed some obvious way to do, maybe I should rely on a principle I did not understand, and I’d be very grateful if someone would point me in a better direction.
Thank you for your answer.
Indeed, I’m using the Icingaweb2 vSphereDB module as a Director import source.
As I’m a bit lost amongst the numerous way to go, I may ask the wrong questions.
First, in your answer, I’m surprised one has to call a shell command (“/usr/bin/icinga”) as I thought it would be design to use an icinga internal command.
Then, when I’m trying to setup the command you wrote ( ‘/usr/bin/icingacli’ ‘vspheredb’…) in the “command” field of a host template, I get a red warning telling me : “Unable to load object (check_command: ‘/usr/bin/icinga’ ‘vspheredb’ …) referenced from host “sitpi_test”, no such object available (IcingaObject.php:572)” so I guess I can not do that this way.
So instead, I’ve created my custom command (‘is_the_vm_powered_on’), and there, I can use this command name into the host template.
Next, onto the custom command, I’ve setup like this :
Command type : Icinga check command
Command name : is_the_vm_powered_on
Command : /usr/bin/icingacli vspheredb check vm --name ${host}
Doing so, I get zero error whatsoever, though I also get no event nor warning nor anything when I’m shutting down the VM. So I guess the check is always returning OK or something similar?
Should I grep the command in order to return some “-1” value or what else?
Did you tell the monitoring rules in the vSphereDB that Virtual Machine is powered on is the only thing that interests you? Dose the state change in the vSphereDB module?
I realize I should have started to ask a very simple question, because I’m an Icinga beginner and I may be doing things wrong. Below, I’m writing an awful long explanation which is not directly related to this main thread, so tell me if I should place it in a separated thread?
Anyway, here it is :
At present, we already have an old Icinga setup in which everything has been setup manually (read : using vim) and which is not maintainable anymore
I’ve installed a brand new Icinga + Director + vSphereDB, and my goal is to automate as much as possible : I’d like to get an Icinga classical dashboard (similar to the old one) where I can see the hosts (virtual or not), but I’d like them to be created automatically by Director, using vSphereDB as an import source
At present, I was able to install all the setup above, and I’ve setup Director (Import source + sync rules) to create the hosts. I haven’t worked yet on the services.
I see that the vSphereDB module is very very rich and full of nice features and displays (pictures of the hypervisors, datastore distribution, past due snapshots, states of each VM…) BUT I’m not interested in keeping an eye on both the main icinga dashboard AND the vSphereDB dashboard. I need to have one single place to look at, so I have to gather everything into the main icinga dashboard.
So, there are things I don’t understand, for instance : I have set up the monitoring rules in the vSphereDB module, but when events are striking some VMs, I don’t see any alert popping into the icinga dashboard (I only see them in the vSphereDB module dashboard). Is it due to the fact that the icinga dashboard is only showing the hosts that were generated by Director, and those may be different objects than those shown in the vSphereDB module, even if they have the same names? (I guess icinga is using uuids for each object, and the host name is only a label).
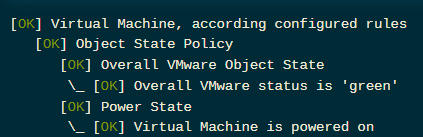
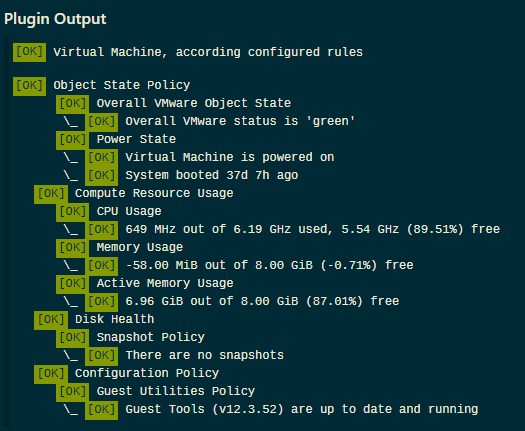
To come back to this thread point : yes I can run the command you advised, and yes I get an output, which is nice, but I’m not sure to fully understand the better way to use the vSphereDB module.
I mean : the vSphereDB module dashboard is looking SO comprehensive that I was expecting that importing the VMs would also ease the import of the checks, like the ones you have shown in your last reply.
I don’t mind doing any work needed, but I need to understand the edge between what I must do and what is provided.
And finally, to answer you last question : yes, when the real VM is changing (power up / power down), I see it changing in the vSphereDB module dashboard, but not in the icinga main dashboard.
The purpose of the vSphereDB module is to collect information from your VMware vCenter or ESX and make it useful for Icinga. It does it in at least 3 ways:
presentation and discoverability in icingaweb2
as import source for the director module - automation
as checks command objects attached to icinga2 host and service objects
So, there are things I don’t understand, for instance : I have set up the monitoring rules in the vSphereDB module, but when events are striking some VMs, I don’t see any alert popping into the icinga dashboard (I only see them in the vSphereDB module dashboard). Is it due to the fact that the icinga dashboard is only showing the hosts that were generated by Director, and those may be different objects than those shown in the vSphereDB module, even if they have the same names? (I guess icinga is using uuids for each object, and the host name is only a label).
In the module you manage the thresholds and conditions but only after you attach the check command to the host or service, it is “active” and results will be usable for your dashboards and trigger your notifications that you also attached to the service and host objects.
By attaching the '/usr/bin/icingacli' 'vspheredb' 'check' 'vm' '--name' 'fqdn' as command of the check-command object to the host or to a service of the host via the director, you enable icinga2 to query the vm object from the vSphereDB module.
you need to close the circle you started with the director with the check:
As I read some of your answers about this same issue to various people having the same question, and as I saw you managed to make it work, I’m very confident you and I will manage to make it clear and figure out what I did not understand. So, please see no offence if I’m detailing very precisely what I’m doing : my hope is for both of us to save some times.
Like a kid, I will also add numbered bullet points to help you rapidly point where my flaws are.
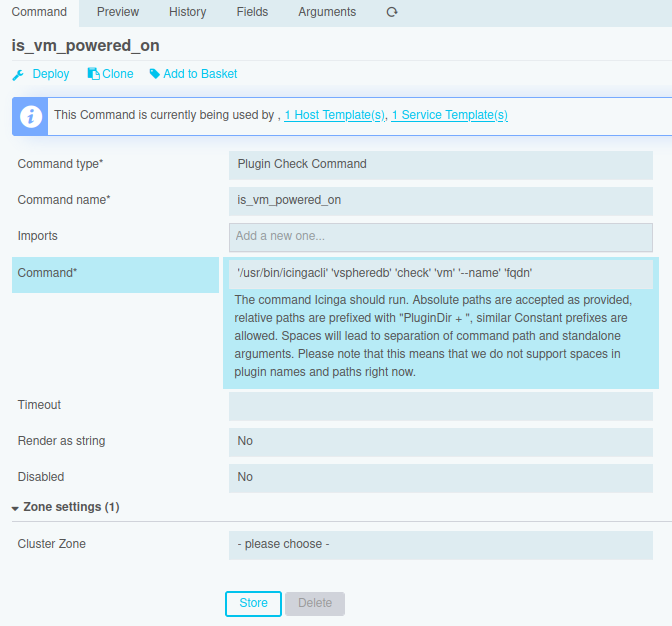
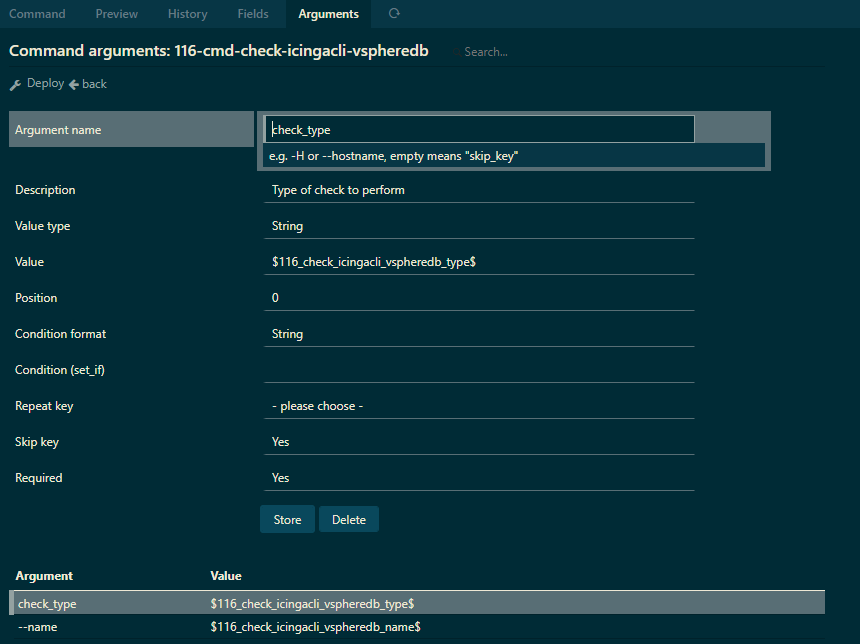
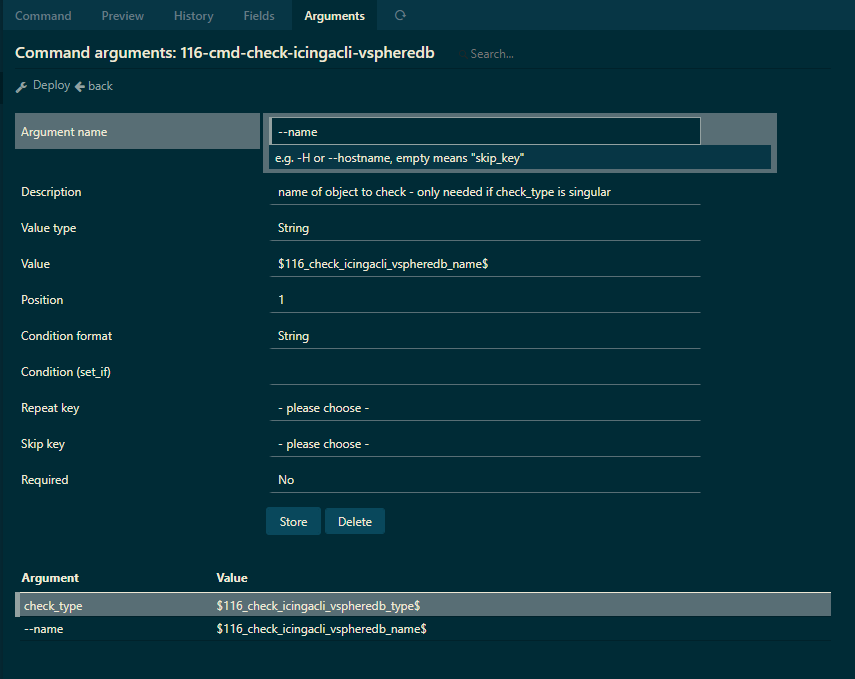
In Director, I create a brand new command, NOT using any command template, which I design this way :
I click on “Store” then I click on “Preview”, and there, I see that Icinga has escaped the single quotes. Indeed, if I try to deploy this command on a test host, the inspect feature is showing that the command will be this terrible string : '/usr/lib/nagios/plugins/'\''/usr/bin/icingacli'\''' ''\''vspheredb'\''' ''\''check'\''' ''\''vm'\''' ''\''--name'\''' ''\''fqdn'\'''
I then remove the single quotes in the command, deploy it and now, the inspect is showing a better [1] string : '/usr/bin/icingacli' 'vspheredb' 'check' 'vm' '--name' 'fqdn'
This check command is still failing because, obviously, nothing nor noone gave icinga the fqdn it is requiring.
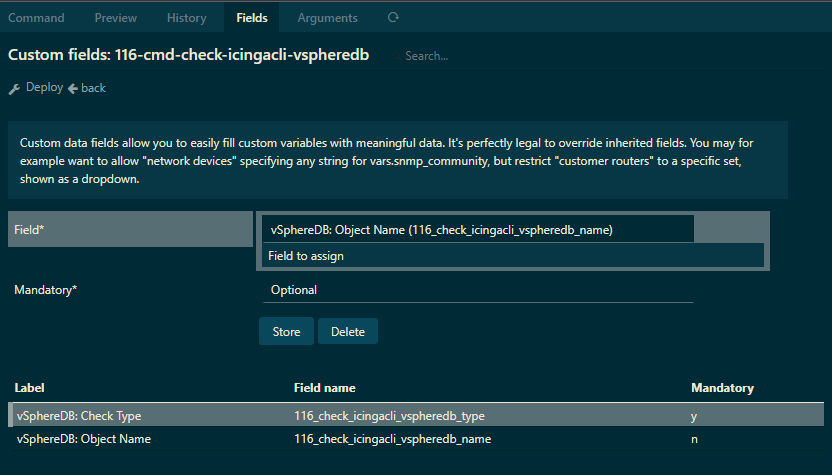
I guess it is here that I may be missing a way to define a field, a variable or something to feed this command with the adequate value? These are points I didn’t get in the docs.
[1] I have just discovered that if the command has a leading slash, the actual check command path won’t be prefixed with /usr/lib/nagios/plugins/ explaining tons of time I wasted trying just to figure this out.
Yes, stuff like this happens, if you work without partner or coworkers, you can ask.
I work with the Linuxfabrik but you can find a list of partners here: https://icinga.com/company/partners/
Or get support directly from the Icinga GmbH.
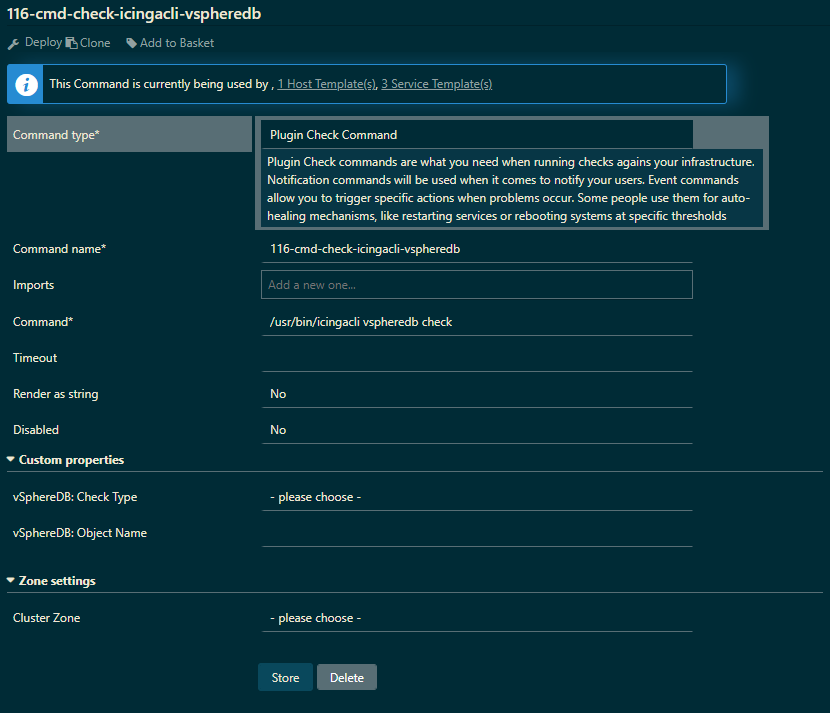
But back on topic - the previews from the director of how I solved it:
zones.d/director-global/servicesets.conf
/**
 * Service Set: 116 vSphereDB VM
 *
 * assign where host.vars.custom_values.icinga_director_teams || "vspheredb-vm" in host.vars.custom_tags
 */

apply Service "Icingacli vSphereDB - VM Status" {
    import "116-tpl-service-vspheredb-vm"

    assign where host.vars.custom_values.icinga_director_teams || "vspheredb-vm" in host.vars.custom_tags

    import DirectorOverrideTemplate
}
if you wonder about host.vars.custom_values.icinga_director_teams, It gets created in the Director automation from the vSphereDB module import source. The goal is to no longer have to manage this kind of information by hand in Icinga.
Hi @rivad ,
Thank you for your very precise answer : very helpful, as I was able to make it work.
Though I did it in a little simpler way than you : I’m not using arguments not fields, but I may change my mind and soon start doing it your way.