I’d grep for “HttpServerConnection” + “Request:”.
@Al2Klimov i have fetched the requests/s to the API in the following way:
Used Log File:
/var/log/icinga2/icinga2.log
Used Commands:
Get start date of log:
head -n1 icinga2.log
=> Start: [2023-08-24 03:28:03 +0200]
Get end date of log:
tail -n1 icinga2.log
=> End: [2023-08-24 16:01:02 +0200]
Get count of matching lines:
grep -i -E '(httpserverconnection.*?request\:)' icinga2.log | wc -l
=> Count: 17912
Calculated Rate
rate = Duration of log in seconds / log count
rate = 48421 / 17912
rate = 2,7 Requests per second
I hope this further helps pointing out any issues with the setup.
The icinga health check graphs will be submitted later, as i already mentioned.
Please let me know if you need more informations in the meantime.
Does your production Meerkat really fire requests like this?
curl -ksSo /dev/null -d '{"filter":"service.name==string('$(($RANDOM % 10))')&&host.name==string('$RANDOM')","pretty":1}' -X GET -u root:a97ccaf00cbaf91a 'https://127.0.0.1:5665/v1/objects/services'
Then please try such instead.
curl -ksSo /dev/null -d '{"pretty":1}' -X GET -u root:a97ccaf00cbaf91a 'https://127.0.0.1:5665/v1/objects/services/'$RANDOM'!'$(($RANDOM % 10))
At least they’re much more efficient, at best a such switch fixes the memory leak like it did in my test system.
Interesting. We are days away from cutting over the problematic meerkat to 3.1.1 which changes the game completely, by using the event stream instead of many API calls.
But I will get @omarsol1 to have a quick look and reply to help track down this memory leak. Perhaps if we can confirm it, we can help fix it.
The current production Meerkat requests using both requests for filter support and when a host or service is specified then it uses the second request but with URL encoded filter instead of JSON data. I have tested and benchmarked the difference in the two requests and have found that it is indeed filters that are causing the memory leak.
This is the icinga spam script running which generates random host names and uses a service named test to send requests using the second api call you mentioned.
    while True:
        for i in range(9999):
            try:
                host_name = 'test' + str(i).zfill(4)
                response = requests.get(f'https://127.0.0.1:5665/v1/objects/services/{host_name}!test', headers=headers, verify=False)
                print(response.status_code)
            except Exception as e:
                print(e)
                continue
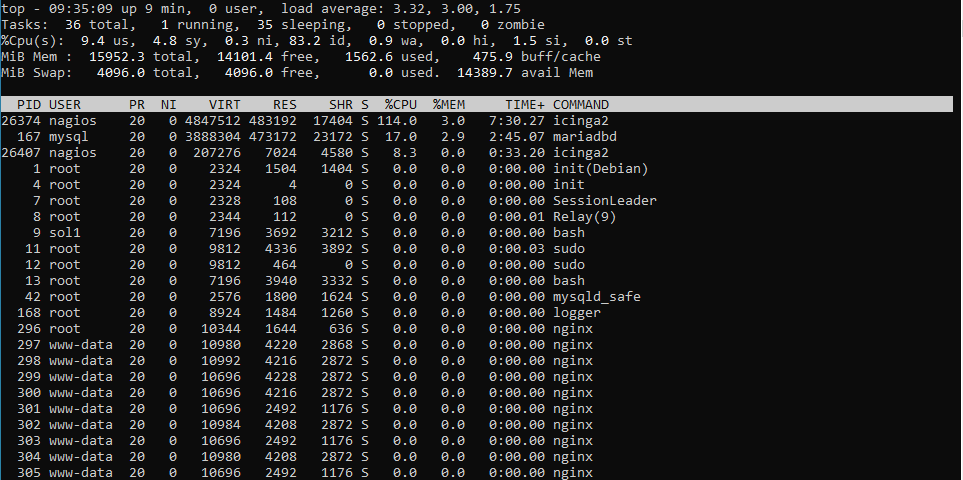
Even after running on 500 threads my memory stayed at around 3% and recovered after stopping the requests. However when using filters I get a much different result.
This script does the same as the previous but instead uses the first api call you mentioned but with url encoded filter instead of using json data.
    while True:
        for i in range(9999):
            try:
                host_name = 'test' + str(i).zfill(4)
                filter_name = f'match(service.name, "test") && host.name == "{host_name}"'
                response = requests.get(f'https://127.0.0.1:5665/v1/objects/services?filter={filter_name}', headers=headers, verify=False)
                print(response.status_code)
            except Exception as e:
                print(e)
                continue
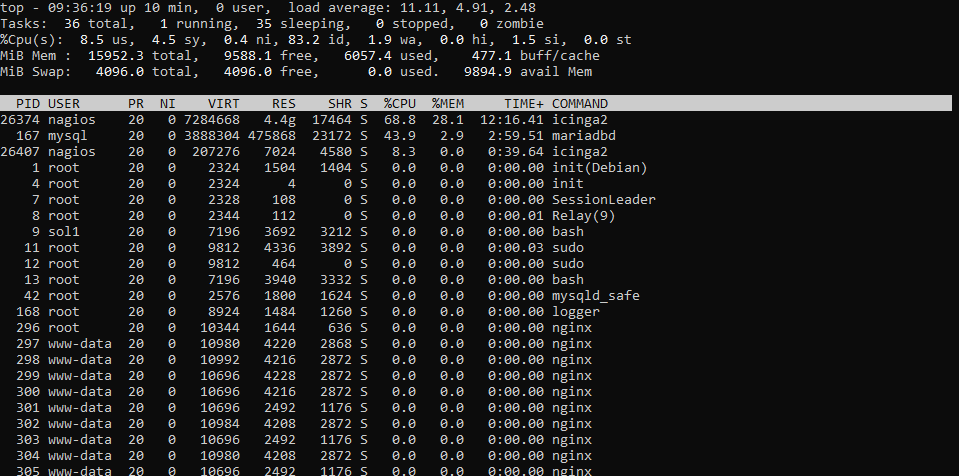
Running this with 100 threads for me jumped my memory instantly to around 30% and after stopping the requests it hasn’t gone down since. We have been using the same format of meerkat requests for a long time and have never had issues with it so there must have been a change to the behaviour of filters in icinga which is causing this. I am happy to work with you to help solve this issue so if you need me to do anything please let me know.
Just an FYI, @omarsol1’s finding seems very plausible to me.
We are also using a bunch of api requests with filters for passive checks and the like.
Edit
I have just taken a look at the monitoring again and wanted to add, that most api requests in our system should be passive checks, which use the following syntax (API filters in POST data):
curl -k -s -u <USER>:<PASSWORD> -H 'Accept: application/json' \
-X POST 'https://<HOST>:5665/v1/actions/process-check-result' \
-d '{ "type": "Service", "filter": "host.name==\"<HOSTNAME>\" && service.name==\"<SERVICENAME>\"", "exit_status": 0, "plugin_output": "<OUTPUT>" }'
Try targeting single objects like described here:
@Al2Klimov in my understanding, there still is a OOM error in icinga2’s API code.
As @omarsol1’s test results show, there seems to be a missing garbage collection or something like that in the source code:
Since the memory does not free, even if the requests have been stopped, it should be clear that either garbage collection is not working or there are some infinite loops somewhere.
It would be extraordinaly high effort to change all our passive checks to another syntax and it would also not be possible for all of them, since a lot of them make use of advanced filters (like checking for the host group), which would not be possible without the filter syntax.
See: Icinga 2 API Advanced Filters
How should we proceed here?
It’s ok if some API calls need advanced filters, but it’s extraordinaly high effort for Icinga to iterate over all objects just to yield one on every single request.
High effort means burns CPU right? Perhaps we are OK with that and can manage it accordingly. However a memory leak doesn’t seem like it should exist, particularly if it doesn’t go down again of course. Should we log a github bug about this with a better report and scripts to reproduce the issue?
I agree with @davekempe, we can manage high effort with scaling of the VM, but memory leaks are a different matter and should definitely be adressed properly.
Since Valgrind didn’t find any “actual” leak on my side I think it really may be caused by fragmentation:
https://www.softwareverify.com/blog/memory-fragmentation-your-worst-nightmare/
Such things are unluckily
- exceptionally rare
- caused just indirectly by the application
- rather a result of how the specific application and the specific allocator (version) interact
- lacking one specific code location we could simply fix by calling free(3)
I’ll see what I can do, but honestly speaking this would be the first bug of that kind in my whole IT career (since Jan 2014).
OK, so I think I might work with Omar to get Valgrind going and see how we can find this leak. We will write up the process as best we can, and lodge a bug once we find something concrete. It will be a good exercise if nothing else.
Now we have a reliable way of reproducing the problem, we will also find different memory allocators and see what difference they make. Maybe even try zram!
Some kernel tuning options might also assist with figuring out if its a leak vs fragmentation.
Maybe you’ll have success with Valgrind. But caution! What your shell resolves as “icinga2” is just a shell script. See its contents for the actual icinga2 binary. Apropos. The latter likely needs the following patch not to exec(3)-off Valgrind.
--- icinga-app/icinga.cpp
+++ icinga-app/icinga.cpp
@@ -281,7 +281,4 @@ static int Main()
        }

-       if (!autocomplete)
-               Application::SetResourceLimits();
-
        LogSeverity logLevel = Logger::GetConsoleLogSeverity();
        Logger::SetConsoleLogSeverity(LogWarning);
Thank you for testing. Based on those data I have built a solution.
To all readers here
Whoever of you is an Icinga customer/partner, please:
- Open a support ticket referring to this community thread if not already done
- Say Icinga sr. dev. Alexander Klimov (that’s me) has some packages for you to test
- Specify your Icinga and OS version(s)
Alternatively
If you’re inpatient and technically skilled, you’re free to build commit af3a60f5277d770c878b6c9e4d39b1ac37e57ab0 by yourself instead.
@Al2Klimov thank you for looking into this issue! ![]()
Are there any plans to include the fix in a future release yet?
In other words: Did the solution already seem like it fixes the issue and is a release planned at all?
I’m afraid this isn’t enough. We also need to know whether this fixes the issue for our users. Unfortunately no one has requested any packages yet, not to mention testing feedback.
@Al2Klimov i completely understand what you mean.
In my understanding your fix is a general improvement of the api filters, so wouldnt it be generally beneficial for all icinga users, regardless of a memory leak or not?
Unfortunately i do not have icinga support, but could you maybe still point me in the right direction or supply me with a test build?
I would absolutely try to help you and test the new feature if that would be possible.
I think other icinga users which also face the memory leak maybe wont find this post as i also struggled with finding a solution online, so i dont think there will be a lot of feedback if it is not actively seeked.
TLDR:
I am eager to help find out if this is a fix which would benefit icinga users and mitigate the problem at hand.
@davekempe @omarsol1 would you also agree with me here?
What’s your OS version?
Hi yes, we agree, however I must admit the urgency left, as we pulled down the checks that were causing the issue, as it was for the Women’s World Cup, and thats over now ![]()
Omar did compile a version from source and I believe he was able to still reproduce the memory leak, however we have some more time now, so I will get him to try again, and report back here.
We are going to OSMC in November, so absolutely worst case, we get to troubleshoot this over a beer in Nuremberg ![]()