Memory leak despite 2.14 upgrade - how to debug?

Hi,
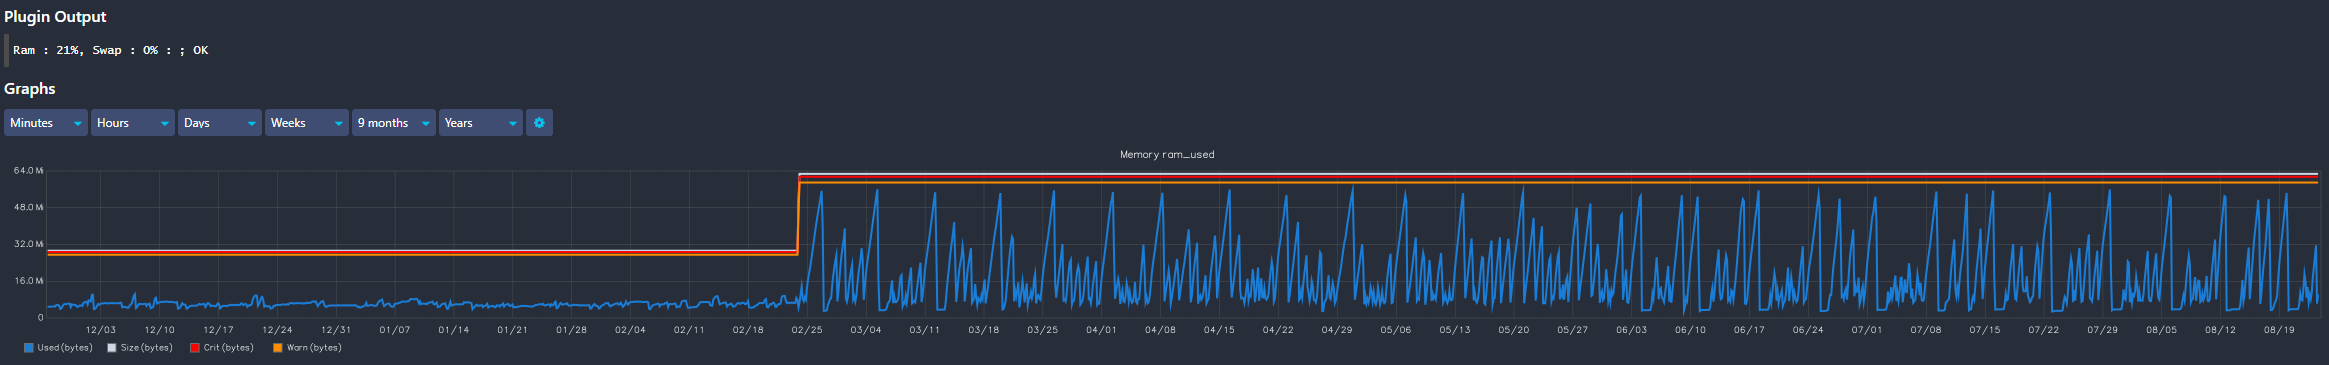
we are currently seeing a large increase in memory usage after we enabled some passive checks. We have a few other things going on in this system, so working out which of the new things are causing the problem is something we are going to have to work through. At a basic level the current problem is:
icinga2 starts and then OOMs out after a few days at about 8G of RAM used.

After about 30mins of run time:
smem -ak |grep icinga2
3284954 root grep icinga2 0 348.0K 437.0K 2.2M
3271908 nagios /usr/lib/x86_64-linux-gnu/icinga2/sbin/icinga2 --no-stack-rlimit daemon --close-stdi 184.0K 308.0K 1.7M 6.0M
3271809 nagios /usr/lib/x86_64-linux-gnu/icinga2/sbin/icinga2 --no-stack-rlimit daemon --close-stdi 0 1.7M 6.1M 17.4M
3271867 nagios /usr/lib/x86_64-linux-gnu/icinga2/sbin/icinga2 --no-stack-rlimit daemon --close-stdi 0 1.4G 1.4G 1.4G

This icinga install is weird in a few ways which I will get to, but first the basics:
Version:
icinga2 --version:
icinga2 - The Icinga 2 network monitoring daemon (version: r2.14.0-1)

Copyright (c) 2012-2023 Icinga GmbH (https://icinga.com/)
License GPLv2+: GNU GPL version 2 or later https://gnu.org/licenses/gpl2.html
This is free software: you are free to change and redistribute it.
There is NO WARRANTY, to the extent permitted by law.

System information:
Platform: Debian GNU/Linux
Platform version: 11 (bullseye)
Kernel: Linux
Kernel version: 5.10.0-23-amd64
Architecture: x86_64

Build information:
Compiler: GNU 10.2.1
Build host: runner-hh8q3bz2-project-575-concurrent-0
OpenSSL version: OpenSSL 1.1.1n 15 Mar 2022

icinga2 feature list

Disabled features: command compatlog debuglog elasticsearch gelf graphite icingadb influxdb influxdb2 journald livestatus opentsdb perfdata statusdata syslog
Enabled features: api checker ido-mysql mainlog notification

(Yes I disabled influxdbwriter in case it was that)
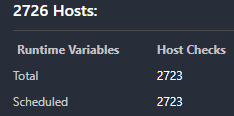
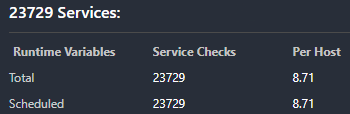
Some idea on scale:
[2023-07-30 23:26:28 +0000] information/ConfigItem: Instantiated 6 NotificationCommands.
[2023-07-30 23:26:28 +0000] information/ConfigItem: Instantiated 378 Notifications.
[2023-07-30 23:26:28 +0000] information/ConfigItem: Instantiated 1 IcingaApplication.
[2023-07-30 23:26:28 +0000] information/ConfigItem: Instantiated 1932 Hosts.
[2023-07-30 23:26:28 +0000] information/ConfigItem: Instantiated 1373 HostGroups.
[2023-07-30 23:26:28 +0000] information/ConfigItem: Instantiated 1 Downtime.
[2023-07-30 23:26:28 +0000] information/ConfigItem: Instantiated 63 Comments.
[2023-07-30 23:26:28 +0000] information/ConfigItem: Instantiated 1 IdoMysqlConnection.
[2023-07-30 23:26:28 +0000] information/ConfigItem: Instantiated 1 FileLogger.
[2023-07-30 23:26:28 +0000] information/ConfigItem: Instantiated 40 Zones.
[2023-07-30 23:26:28 +0000] information/ConfigItem: Instantiated 1 CheckerComponent.
[2023-07-30 23:26:28 +0000] information/ConfigItem: Instantiated 38 Endpoints.
[2023-07-30 23:26:28 +0000] information/ConfigItem: Instantiated 11 ApiUsers.
[2023-07-30 23:26:28 +0000] information/ConfigItem: Instantiated 1 NotificationComponent.
[2023-07-30 23:26:28 +0000] information/ConfigItem: Instantiated 1 ApiListener.
[2023-07-30 23:26:28 +0000] information/ConfigItem: Instantiated 327 CheckCommands.
[2023-07-30 23:26:28 +0000] information/ConfigItem: Instantiated 5 TimePeriods.
[2023-07-30 23:26:28 +0000] information/ConfigItem: Instantiated 3 UserGroups.
[2023-07-30 23:26:28 +0000] information/ConfigItem: Instantiated 111 Users.
[2023-07-30 23:26:28 +0000] information/ConfigItem: Instantiated 6565 Services.
[2023-07-30 23:26:28 +0000] information/ConfigItem: Instantiated 704 ServiceGroups.
[2023-07-30 23:26:28 +0000] information/ConfigItem: Instantiated 1 ScheduledDowntime.

icinga2 object list|grep check_command|wc -l
8564
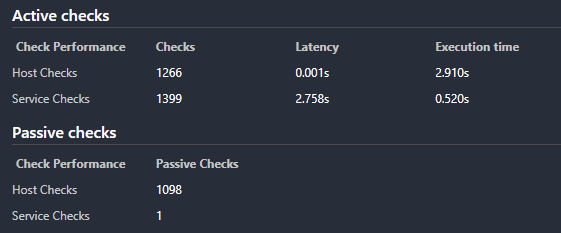
icinga2 object list|grep check_command|grep passive|wc -l
812

The weird stuff is that this instance is also hit very hard on the API call front. While this load has been present for a long time, the passive checks is new, and other API calls are newish (arriving for the same project). So its hard to tell exactly what config change we made triggered this enormous memory usage. Upgrading to 2.14 didn’t help the situation unfortunately.

Any ideas on how to debug this further? Is there some magic way we can inspect the icinga2 process to figure out which bit is triggering the memory usage?
We are busy building a lab replica of the environment so we can further understand the problem and adjust various parameters to find the leak.

here is the OOM error:

[Tue Jul 25 20:42:49 2023] haproxy invoked oom-killer: gfp_mask=0x100cca(GFP_HIGHUSER_MOVABLE), order=0, oom_score_adj=0
[Tue Jul 25 20:42:49 2023] CPU: 7 PID: 1038 Comm: haproxy Not tainted 5.10.0-23-amd64 #1 Debian 5.10.179-1
[Tue Jul 25 20:42:49 2023] Hardware name: VMware, Inc. VMware Virtual Platform/440BX Desktop Reference Platform, BIOS 6.00 11/12/2020
[Tue Jul 25 20:42:49 2023] Call Trace:
[Tue Jul 25 20:42:49 2023] dump_stack+0x6b/0x83
[Tue Jul 25 20:42:49 2023] dump_header+0x4a/0x1f4
[Tue Jul 25 20:42:49 2023] oom_kill_process.cold+0xb/0x10
[Tue Jul 25 20:42:49 2023] out_of_memory+0x1bd/0x4e0
[Tue Jul 25 20:42:49 2023] __alloc_pages_slowpath.constprop.0+0xbcc/0xc90
[Tue Jul 25 20:42:49 2023] __alloc_pages_nodemask+0x2de/0x310
[Tue Jul 25 20:42:49 2023] pagecache_get_page+0x175/0x390
[Tue Jul 25 20:42:49 2023] filemap_fault+0x6a2/0x900
[Tue Jul 25 20:42:49 2023] ? xas_load+0x5/0x80
[Tue Jul 25 20:42:49 2023] ext4_filemap_fault+0x2d/0x50 [ext4]
[Tue Jul 25 20:42:49 2023] __do_fault+0x34/0x170
[Tue Jul 25 20:42:49 2023] handle_mm_fault+0x124f/0x1c00
[Tue Jul 25 20:42:49 2023] ? __hrtimer_init+0xd0/0xd0
[Tue Jul 25 20:42:49 2023] do_user_addr_fault+0x1b8/0x400
[Tue Jul 25 20:42:49 2023] ? switch_fpu_return+0x44/0xc0
[Tue Jul 25 20:42:49 2023] exc_page_fault+0x78/0x160
[Tue Jul 25 20:42:49 2023] ? asm_exc_page_fault+0x8/0x30
[Tue Jul 25 20:42:49 2023] asm_exc_page_fault+0x1e/0x30
[Tue Jul 25 20:42:49 2023] RIP: 0033:0x555bb5df91b3
[Tue Jul 25 20:42:49 2023] Code: Unable to access opcode bytes at RIP 0x555bb5df9189.
[Tue Jul 25 20:42:49 2023] RSP: 002b:00007f7193fec370 EFLAGS: 00010202
[Tue Jul 25 20:42:49 2023] RAX: 0000000000000000 RBX: 00000000000001ca RCX: 00007f71a0698d56
[Tue Jul 25 20:42:49 2023] RDX: 00000000000000c8 RSI: 00007f7140015c50 RDI: 0000000000000000
[Tue Jul 25 20:42:49 2023] RBP: 00000000000001ca R08: 0000000000000000 R09: ffffffffffff7ef8
[Tue Jul 25 20:42:49 2023] R10: 00000000000001ca R11: 0000000000000000 R12: 000000008eca42f6
[Tue Jul 25 20:42:49 2023] R13: 0000000000000000 R14: ffffffffffff7e70 R15: 0000000eab17b600
[Tue Jul 25 20:42:49 2023] Mem-Info:
[Tue Jul 25 20:42:49 2023] active_anon:2282074 inactive_anon:5746309 isolated_anon:0
active_file:0 inactive_file:334 isolated_file:0
unevictable:1 dirty:0 writeback:0
slab_reclaimable:37987 slab_unreclaimable:32888
mapped:5865 shmem:5715 pagetables:23912 bounce:0
free:49420 free_pcp:248 free_cma:0
[Tue Jul 25 20:42:49 2023] Node 0 active_anon:9128296kB inactive_anon:22985236kB active_file:0kB inactive_file:1336kB unevictable:4kB isolated(anon):0kB isolated(file):0kB mapped:23460kB dirty:0kB writeback:0kB shmem:22860kB shmem_thp: 0kB shmem_pmdmapped: 0kB anon_thp: 13916160kB writeback_tmp:0kB kernel_stack:9520kB all_unreclaimable? yes
[Tue Jul 25 20:42:49 2023] Node 0 DMA free:11812kB min:32kB low:44kB high:56kB reserved_highatomic:0KB active_anon:0kB inactive_anon:0kB active_file:0kB inactive_file:0kB unevictable:0kB writepending:0kB present:15992kB managed:15908kB mlocked:0kB pagetables:0kB bounce:0kB free_pcp:0kB local_pcp:0kB free_cma:0kB
[Tue Jul 25 20:42:49 2023] lowmem_reserve[]: 0 2964 32045 32045 32045
[Tue Jul 25 20:42:49 2023] Node 0 DMA32 free:122556kB min:6248kB low:9280kB high:12312kB reserved_highatomic:0KB active_anon:526860kB inactive_anon:2377692kB active_file:292kB inactive_file:0kB unevictable:0kB writepending:0kB present:3129216kB managed:3063680kB mlocked:0kB pagetables:1736kB bounce:0kB free_pcp:0kB local_pcp:0kB free_cma:0kB
[Tue Jul 25 20:42:49 2023] lowmem_reserve[]: 0 0 29081 29081 29081
[Tue Jul 25 20:42:49 2023] Node 0 Normal free:63312kB min:61300kB low:91076kB high:120852kB reserved_highatomic:0KB active_anon:8601436kB inactive_anon:20607332kB active_file:0kB inactive_file:2356kB unevictable:4kB writepending:0kB present:30408704kB managed:29786616kB mlocked:4kB pagetables:93912kB bounce:0kB free_pcp:992kB local_pcp:0kB free_cma:0kB
[Tue Jul 25 20:42:49 2023] lowmem_reserve[]: 0 0 0 0 0
[Tue Jul 25 20:42:49 2023] Node 0 DMA: 14kB (U) 08kB 016kB 132kB (U) 264kB (U) 1128kB (U) 1256kB (U) 0512kB 11024kB (U) 12048kB (M) 24096kB (M) = 11812kB
[Tue Jul 25 20:42:49 2023] Node 0 DMA32: 395
4kB (UME) 3348kB (UME) 94416kB (UME) 74732kB (UME) 42664kB (UME) 132128kB (UME) 72256kB (UME) 28512kB (UE) 31024kB (ME) 02048kB 04096kB = 123260kB
[Tue Jul 25 20:42:49 2023] Node 0 Normal: 20154kB (UME) 9958kB (UME) 95016kB (UME) 48232kB (ME) 16664kB (UME) 41128kB (ME) 8256kB (ME) 2512kB (UM) 01024kB 02048kB 0*4096kB = 65588kB
[Tue Jul 25 20:42:49 2023] Node 0 hugepages_total=0 hugepages_free=0 hugepages_surp=0 hugepages_size=1048576kB
[Tue Jul 25 20:42:49 2023] Node 0 hugepages_total=0 hugepages_free=0 hugepages_surp=0 hugepages_size=2048kB
[Tue Jul 25 20:42:49 2023] 205698 total pagecache pages
[Tue Jul 25 20:42:49 2023] 199163 pages in swap cache
[Tue Jul 25 20:42:49 2023] Swap cache stats: add 17704135, delete 17515334, find 83537704/84268080
[Tue Jul 25 20:42:49 2023] Free swap = 0kB
[Tue Jul 25 20:42:49 2023] Total swap = 10485756kB
[Tue Jul 25 20:42:49 2023] 8388478 pages RAM
[Tue Jul 25 20:42:49 2023] 0 pages HighMem/MovableOnly
[Tue Jul 25 20:42:49 2023] 171927 pages reserved
[Tue Jul 25 20:42:49 2023] 0 pages hwpoisoned
[Tue Jul 25 20:42:49 2023] Tasks state (memory values in pages):
[Tue Jul 25 20:42:49 2023] [ pid ] uid tgid total_vm rss pgtables_bytes swapents oom_score_adj name
[Tue Jul 25 20:42:49 2023] [ 567] 0 567 81018 343 643072 495 -250 systemd-journal
[Tue Jul 25 20:42:49 2023] [ 591] 0 591 5535 161 69632 265 -1000 systemd-udevd
[Tue Jul 25 20:42:49 2023] [ 856] 107 856 1975 47 53248 66 0 rpcbind
[Tue Jul 25 20:42:49 2023] [ 858] 0 858 11937 111 86016 261 0 VGAuthService
[Tue Jul 25 20:42:49 2023] [ 859] 0 859 59065 633 98304 196 0 vmtoolsd
[Tue Jul 25 20:42:49 2023] [ 860] 104 860 2098 144 53248 48 -900 dbus-daemon
[Tue Jul 25 20:42:49 2023] [ 864] 0 864 567842 8880 585728 3309 0 jumpcloud-agent
[Tue Jul 25 20:42:49 2023] [ 868] 0 868 2866 193 57344 80 0 openvpn
[Tue Jul 25 20:42:49 2023] [ 874] 0 874 72716 752 94208 172 0 rsyslogd
[Tue Jul 25 20:42:49 2023] [ 881] 0 881 3497 171 65536 95 0 systemd-logind
[Tue Jul 25 20:42:49 2023] [ 885] 109 885 18649 106 61440 71 0 ntpd
[Tue Jul 25 20:42:49 2023] [ 886] 0 886 1686 37 57344 28 0 cron
[Tue Jul 25 20:42:49 2023] [ 917] 0 917 1461 0 49152 32 0 agetty
[Tue Jul 25 20:42:49 2023] [ 1004] 108 1004 2874342 1640982 16629760 310385 0 mariadbd
[Tue Jul 25 20:42:49 2023] [ 1017] 0 1017 58858 1734 204800 1495 0 apache2
[Tue Jul 25 20:42:49 2023] [ 1022] 0 1022 36879 85 172032 9535 0 haproxy
[Tue Jul 25 20:42:49 2023] [ 1027] 110 1027 378478 12861 401408 8917 0 haproxy
[Tue Jul 25 20:42:49 2023] [ 1279] 0 1279 10012 29 69632 133 0 master
[Tue Jul 25 20:42:49 2023] [ 1282] 112 1282 10124 62 77824 137 0 qmgr
[Tue Jul 25 20:42:49 2023] [ 1317] 997 1317 1170972 43123 1310720 26970 0 vector
[Tue Jul 25 20:42:49 2023] [ 1371] 997 1371 229133 76 1355776 132 0 journalctl
[Tue Jul 25 20:42:49 2023] [ 2120] 0 2120 3683 7 69632 302 0 sshd
[Tue Jul 25 20:42:49 2023] [ 2167] 1006 2167 3828 149 73728 174 0 systemd
[Tue Jul 25 20:42:49 2023] [ 2169] 1006 2169 41736 106 98304 543 0 (sd-pam)
[Tue Jul 25 20:42:49 2023] [ 2219] 1006 2219 3683 44 69632 266 0 sshd
[Tue Jul 25 20:42:49 2023] [ 2224] 1006 2224 2171 38 53248 487 0 bash
[Tue Jul 25 20:42:49 2023] [ 102182] 112 102182 11027 59 77824 191 0 tlsmgr
[Tue Jul 25 20:42:49 2023] [1078586] 0 1078586 3683 43 69632 271 0 sshd
[Tue Jul 25 20:42:49 2023] [1078761] 1012 1078761 3828 268 69632 54 0 systemd
[Tue Jul 25 20:42:49 2023] [1078762] 1012 1078762 41730 82 98304 644 0 (sd-pam)
[Tue Jul 25 20:42:49 2023] [1078782] 1012 1078782 4309 608 77824 374 0 sshd
[Tue Jul 25 20:42:49 2023] [1078783] 1012 1078783 2213 1 53248 561 0 bash
[Tue Jul 25 20:42:49 2023] [ 191820] 0 191820 3683 13 65536 296 0 sshd
[Tue Jul 25 20:42:49 2023] [ 191833] 1006 191833 3683 39 65536 271 0 sshd
[Tue Jul 25 20:42:49 2023] [ 191834] 1006 191834 2042 169 53248 220 0 bash
[Tue Jul 25 20:42:49 2023] [ 248759] 0 248759 3683 7 69632 303 0 sshd
[Tue Jul 25 20:42:49 2023] [ 248765] 1006 248765 3683 30 69632 281 0 sshd
[Tue Jul 25 20:42:49 2023] [ 248766] 1006 248766 2042 117 53248 272 0 bash
[Tue Jul 25 20:42:49 2023] [ 248847] 1006 248847 3011 142 61440 35 0 ssh
[Tue Jul 25 20:42:49 2023] [1023190] 0 1023190 3683 58 65536 252 0 sshd
[Tue Jul 25 20:42:49 2023] [1023198] 1006 1023198 3683 101 65536 222 0 sshd
[Tue Jul 25 20:42:49 2023] [1023199] 1006 1023199 2042 126 57344 263 0 bash
[Tue Jul 25 20:42:49 2023] [1023235] 1006 1023235 3041 214 61440 15 0 ssh
[Tue Jul 25 20:42:49 2023] [1206558] 1006 1206558 2697 52 57344 96 0 sudo
[Tue Jul 25 20:42:49 2023] [1206559] 0 1206559 2042 389 53248 4 0 bash
[Tue Jul 25 20:42:49 2023] [1773676] 106 1773676 362499 149 233472 448 0 icinga2
[Tue Jul 25 20:42:49 2023] [2876162] 106 2876162 8647662 5970931 66658304 2258144 0 icinga2
[Tue Jul 25 20:42:49 2023] [2876203] 106 2876203 362499 209 217088 395 0 icinga2
[Tue Jul 25 20:42:49 2023] [3540786] 0 3540786 3338 171 65536 67 -1000 sshd
[Tue Jul 25 20:42:49 2023] [3542014] 33 3542014 79714 5869 282624 2408 0 apache2
[Tue Jul 25 20:42:49 2023] [3543940] 33 3543940 79297 5964 282624 2053 0 apache2
[Tue Jul 25 20:42:49 2023] [3762914] 0 3762914 3683 304 65536 9 0 sshd
[Tue Jul 25 20:42:49 2023] [3762929] 1012 3762929 3735 331 69632 89 0 sshd
[Tue Jul 25 20:42:49 2023] [3762931] 1012 3762931 2349 531 61440 51 0 bash
[Tue Jul 25 20:42:49 2023] [3780198] 1012 3780198 2697 120 57344 28 0 sudo
[Tue Jul 25 20:42:49 2023] [3780224] 0 3780224 2341 554 61440 139 0 bash
[Tue Jul 25 20:42:49 2023] [3863842] 33 3863842 78462 4600 245760 1392 0 apache2
[Tue Jul 25 20:42:49 2023] [3866825] 33 3866825 59862 4434 233472 1314 0 apache2
[Tue Jul 25 20:42:49 2023] [3866826] 33 3866826 59846 4444 233472 1316 0 apache2
[Tue Jul 25 20:42:49 2023] [3867829] 33 3867829 59844 4435 233472 1314 0 apache2
[Tue Jul 25 20:42:49 2023] [3867837] 33 3867837 59848 4441 233472 1313 0 apache2
[Tue Jul 25 20:42:49 2023] [3867838] 33 3867838 59847 4432 233472 1315 0 apache2
[Tue Jul 25 20:42:49 2023] [4049422] 33 4049422 59861 4474 233472 1271 0 apache2
[Tue Jul 25 20:42:49 2023] [4049423] 33 4049423 59858 4652 233472 1267 0 apache2
[Tue Jul 25 20:42:49 2023] [ 20419] 998 20419 27057 3181 196608 0 0 icingacli
[Tue Jul 25 20:42:49 2023] [ 44063] 112 44063 10076 162 61440 0 0 pickup
[Tue Jul 25 20:42:49 2023] [ 78164] 1036 78164 3822 299 69632 0 0 systemd
[Tue Jul 25 20:42:49 2023] [ 78165] 1036 78165 42247 628 102400 122 0 (sd-pam)
[Tue Jul 25 20:42:49 2023] [ 78187] 998 78187 51190 27210 397312 0 0 icingacli
[Tue Jul 25 20:42:49 2023] [ 78222] 106 78222 8873 4777 106496 0 0 python3
[Tue Jul 25 20:42:49 2023] [ 78223] 106 78223 8438 4297 102400 0 0 python3
[Tue Jul 25 20:42:49 2023] [ 78224] 106 78224 8566 4413 106496 0 0 python3
[Tue Jul 25 20:42:49 2023] [ 78225] 106 78225 8874 4762 110592 0 0 python3
[Tue Jul 25 20:42:49 2023] [ 78226] 106 78226 8938 4781 110592 0 0 python3
[Tue Jul 25 20:42:49 2023] [ 78227] 106 78227 8938 4780 110592 0 0 python3
[Tue Jul 25 20:42:49 2023] [ 78228] 106 78228 8938 4779 106496 0 0 python3
[Tue Jul 25 20:42:49 2023] [ 78229] 106 78229 6939 2823 90112 0 0 python3
[Tue Jul 25 20:42:49 2023] [ 78231] 106 78231 7299 3172 98304 0 0 python3
[Tue Jul 25 20:42:49 2023] [ 78233] 106 78233 7299 3158 98304 0 0 python3
[Tue Jul 25 20:42:49 2023] [ 78234] 106 78234 7398 3266 94208 0 0 python3
[Tue Jul 25 20:42:49 2023] [ 78235] 106 78235 7630 3497 98304 0 0 python3
[Tue Jul 25 20:42:49 2023] [ 78239] 106 78239 7332 3198 98304 0 0 python3
[Tue Jul 25 20:42:49 2023] [ 78241] 106 78241 7135 2947 98304 0 0 python3
[Tue Jul 25 20:42:49 2023] [ 78242] 106 78242 6762 2686 94208 0 0 python3
[Tue Jul 25 20:42:49 2023] [ 78243] 106 78243 6933 2815 90112 0 0 python3
[Tue Jul 25 20:42:49 2023] [ 78244] 106 78244 6629 2534 90112 0 0 python3
[Tue Jul 25 20:42:49 2023] [ 78245] 106 78245 6762 2677 94208 0 0 python3
[Tue Jul 25 20:42:49 2023] [ 78246] 106 78246 6861 2734 90112 0 0 python3
[Tue Jul 25 20:42:49 2023] [ 78247] 106 78247 27030 2699 200704 0 0 icingacli
[Tue Jul 25 20:42:49 2023] [ 78248] 106 78248 6762 2691 94208 0 0 python3
[Tue Jul 25 20:42:49 2023] [ 78249] 106 78249 26518 2524 196608 0 0 icingacli
[Tue Jul 25 20:42:49 2023] [ 78250] 106 78250 6939 2823 98304 0 0 python3
[Tue Jul 25 20:42:49 2023] [ 78251] 106 78251 6680 2614 86016 0 0 python3
[Tue Jul 25 20:42:49 2023] [ 78252] 106 78252 27030 2863 196608 0 0 icingacli
[Tue Jul 25 20:42:49 2023] [ 78253] 106 78253 27030 2569 208896 0 0 icingacli
[Tue Jul 25 20:42:49 2023] [ 78254] 106 78254 5280 2051 81920 0 0 python3
[Tue Jul 25 20:42:49 2023] [ 78255] 106 78255 25590 1272 188416 0 0 icingacli
[Tue Jul 25 20:42:49 2023] [ 78256] 106 78256 25435 1135 188416 0 0 icingacli
[Tue Jul 25 20:42:49 2023] [ 78257] 106 78257 5182 1949 77824 0 0 python3
[Tue Jul 25 20:42:49 2023] [ 78258] 106 78258 24130 868 176128 0 0 icingacli
[Tue Jul 25 20:42:49 2023] [ 78259] 106 78259 13042 369 94208 0 0 icingacli
[Tue Jul 25 20:42:49 2023] [ 78260] 106 78260 19770 702 143360 0 0 icingacli
[Tue Jul 25 20:42:49 2023] [ 78261] 106 78261 3622 538 65536 0 0 python3
[Tue Jul 25 20:42:49 2023] [ 78262] 106 78262 11725 154 73728 0 0 icingacli
[Tue Jul 25 20:42:49 2023] [ 78263] 106 78263 3392 349 69632 0 0 python3
[Tue Jul 25 20:42:49 2023] [ 78264] 106 78264 362499 224 208896 380 0 icinga2
[Tue Jul 25 20:42:49 2023] [ 78265] 106 78265 3161 41 61440 0 0 python3
[Tue Jul 25 20:42:49 2023] [ 78266] 106 78266 3161 41 61440 0 0 python3
[Tue Jul 25 20:42:49 2023] [ 78268] 0 78268 2253 40 49152 0 0 sshd
[Tue Jul 25 20:42:49 2023] oom-kill:constraint=CONSTRAINT_NONE,nodemask=(null),cpuset=/,mems_allowed=0,global_oom,task_memcg=/system.slice/icinga2.service,task=icinga2,pid=2876162,uid=106
[Tue Jul 25 20:42:49 2023] Out of memory: Killed process 2876162 (icinga2) total-vm:34590648kB, anon-rss:23883724kB, file-rss:0kB, shmem-rss:0kB, UID:106 pgtables:65096kB oom_score_adj:0
[Tue Jul 25 20:42:52 2023] oom_reaper: reaped process 2876162 (icinga2), now anon-rss:0kB, file-rss:0kB, shmem-rss:0kB

Hello Dave!

The main suspect of mine is the IDO. Please raise mainlog level to “notice” – do you observe “IdoMysqlConnection” “WorkQueue” log messages with increasing numbers or even “empty in infinite time, your task handler isn’t able to keep up”?

Also people reported (

https://github.com/Icinga/icinga2/issues/8737#issuecomment-1000551057

) that the mitigation of a completely different problem

https://icinga.com/docs/icinga-2/latest/doc/15-troubleshooting/#try-swapping-out-the-allocator

fixed their memory leaks. Please try it as well.

Best,
A/K

hey,
thanks for getting back to me!
Here is a sample of WorkQueue. We have a very heavy load on the API due to an old version of Meerkat hitting it hard. We have a new version coming out soon that reduces this load.

[2023-08-01 21:57:09 +0000] information/WorkQueue: #7 (ApiListener, RelayQueue) items: 0, rate: 392.05/s (23523/min 118084/5min 354363/15min);
[2023-08-01 21:59:09 +0000] information/WorkQueue: #8 (ApiListener, SyncQueue) items: 0, rate: 0/s (0/min 0/5min 0/15min);
[2023-08-01 22:02:09 +0000] information/WorkQueue: #7 (ApiListener, RelayQueue) items: 0, rate: 382.933/s (22976/min 116122/5min 352519/15min);
[2023-08-01 22:04:09 +0000] information/WorkQueue: #8 (ApiListener, SyncQueue) items: 0, rate: 0/s (0/min 0/5min 0/15min);
[2023-08-01 22:06:59 +0000] information/WorkQueue: #7 (ApiListener, RelayQueue) items: 2, rate: 384.183/s (23051/min 115244/5min 349208/15min);
[2023-08-01 22:07:09 +0000] information/WorkQueue: #7 (ApiListener, RelayQueue) items: 0, rate: 390.45/s (23427/min 115156/5min 349430/15min);
[2023-08-01 22:07:59 +0000] information/WorkQueue: #7 (ApiListener, RelayQueue) items: 3, rate: 400.85/s (24051/min 115933/5min 349327/15min);
[2023-08-01 22:09:09 +0000] information/WorkQueue: #8 (ApiListener, SyncQueue) items: 0, rate: 0/s (0/min 0/5min 0/15min);
[2023-08-01 22:12:19 +0000] information/WorkQueue: #7 (ApiListener, RelayQueue) items: 0, rate: 398.75/s (23925/min 117557/5min 348681/15min);
[2023-08-01 22:14:09 +0000] information/WorkQueue: #8 (ApiListener, SyncQueue) items: 0, rate: 0/s (0/min 0/5min 0/15min);
[2023-08-01 22:17:19 +0000] information/WorkQueue: #7 (ApiListener, RelayQueue) items: 0, rate: 397.05/s (23823/min 118759/5min 351664/15min);
[2023-08-01 22:18:29 +0000] information/WorkQueue: #7 (ApiListener, RelayQueue) items: 4, rate: 397.35/s (23841/min 118168/5min 352617/15min);
[2023-08-01 22:19:09 +0000] information/WorkQueue: #8 (ApiListener, SyncQueue) items: 0, rate: 0/s (0/min 0/5min 0/15min);
[2023-08-01 22:22:09 +0000] information/WorkQueue: #7 (ApiListener, RelayQueue) items: 1, rate: 389.533/s (23372/min 115878/5min 352044/15min);
[2023-08-01 22:22:19 +0000] information/WorkQueue: #7 (ApiListener, RelayQueue) items: 0, rate: 394.4/s (23664/min 115942/5min 352299/15min);
[2023-08-01 22:24:09 +0000] information/WorkQueue: #8 (ApiListener, SyncQueue) items: 0, rate: 0/s (0/min 0/5min 0/15min);
[2023-08-01 22:26:59 +0000] information/WorkQueue: #7 (ApiListener, RelayQueue) items: 1, rate: 376.267/s (22576/min 115955/5min 350752/15min);
[2023-08-01 22:27:19 +0000] information/WorkQueue: #7 (ApiListener, RelayQueue) items: 0, rate: 378.167/s (22690/min 115803/5min 350541/15min);
[2023-08-01 22:29:09 +0000] information/WorkQueue: #8 (ApiListener, SyncQueue) items: 0, rate: 0/s (0/min 0/5min 0/15min);
[2023-08-01 22:32:19 +0000] information/WorkQueue: #7 (ApiListener, RelayQueue) items: 0, rate: 386.433/s (23186/min 116251/5min 348025/15min);
[2023-08-01 22:33:59 +0000] information/WorkQueue: #7 (ApiListener, RelayQueue) items: 1, rate: 384.25/s (23055/min 115782/5min 347463/15min);
[2023-08-01 22:34:09 +0000] information/WorkQueue: #8 (ApiListener, SyncQueue) items: 0, rate: 0/s (0/min 0/5min 0/15min);
[2023-08-01 22:37:19 +0000] information/WorkQueue: #7 (ApiListener, RelayQueue) items: 0, rate: 396.117/s (23767/min 117184/5min 349253/15min);
[2023-08-01 22:37:39 +0000] information/WorkQueue: #7 (ApiListener, RelayQueue) items: 2, rate: 399.617/s (23977/min 117255/5min 349127/15min);
[2023-08-01 22:39:09 +0000] information/WorkQueue: #8 (ApiListener, SyncQueue) items: 0, rate: 0/s (0/min 0/5min 0/15min);
[2023-08-01 22:41:59 +0000] information/WorkQueue: #7 (ApiListener, RelayQueue) items: 1, rate: 380.583/s (22835/min 115654/5min 349332/15min);
[2023-08-01 22:42:19 +0000] information/WorkQueue: #7 (ApiListener, RelayQueue) items: 0, rate: 383.583/s (23015/min 115851/5min 349292/15min);
[2023-08-01 22:44:09 +0000] information/WorkQueue: #8 (ApiListener, SyncQueue) items: 0, rate: 0/s (0/min 0/5min 0/15min);
[2023-08-01 22:47:19 +0000] information/WorkQueue: #7 (ApiListener, RelayQueue) items: 0, rate: 379.817/s (22789/min 116030/5min 349068/15min);
[2023-08-01 22:48:49 +0000] information/WorkQueue: #7 (ApiListener, RelayQueue) items: 1, rate: 401.5/s (24090/min 116306/5min 350225/15min);
[2023-08-01 22:49:09 +0000] information/WorkQueue: #8 (ApiListener, SyncQueue) items: 0, rate: 0/s (0/min 0/5min 0/15min);
[2023-08-01 22:52:19 +0000] information/WorkQueue: #7 (ApiListener, RelayQueue) items: 0, rate: 394.533/s (23672/min 118526/5min 350407/15min);
[2023-08-01 22:52:29 +0000] information/WorkQueue: #7 (ApiListener, RelayQueue) items: 1, rate: 393.767/s (23626/min 118557/5min 350299/15min);
[2023-08-01 22:54:09 +0000] information/WorkQueue: #8 (ApiListener, SyncQueue) items: 0, rate: 0/s (0/min 0/5min 0/15min);

[2023-08-01 20:17:43 +0000] information/IdoMysqlConnection: Pending queries: 38 (Input: 194/s; Output: 191/s)
[2023-08-01 20:22:43 +0000] information/IdoMysqlConnection: Pending queries: 55 (Input: 177/s; Output: 177/s)
[2023-08-01 20:27:43 +0000] information/IdoMysqlConnection: Pending queries: 109 (Input: 158/s; Output: 151/s)
[2023-08-01 20:32:43 +0000] information/IdoMysqlConnection: Pending queries: 72 (Input: 173/s; Output: 168/s)
[2023-08-01 20:37:43 +0000] information/IdoMysqlConnection: Pending queries: 37 (Input: 177/s; Output: 187/s)
[2023-08-01 20:42:43 +0000] information/IdoMysqlConnection: Pending queries: 46 (Input: 180/s; Output: 194/s)
[2023-08-01 20:47:43 +0000] information/IdoMysqlConnection: Pending queries: 35 (Input: 185/s; Output: 195/s)
[2023-08-01 20:52:43 +0000] information/IdoMysqlConnection: Pending queries: 20 (Input: 159/s; Output: 173/s)
[2023-08-01 20:57:43 +0000] information/IdoMysqlConnection: Pending queries: 29 (Input: 204/s; Output: 202/s)
[2023-08-01 21:02:43 +0000] information/IdoMysqlConnection: Pending queries: 15 (Input: 162/s; Output: 171/s)
[2023-08-01 21:07:43 +0000] information/IdoMysqlConnection: Pending queries: 19 (Input: 183/s; Output: 196/s)
[2023-08-01 21:12:43 +0000] information/IdoMysqlConnection: Pending queries: 33 (Input: 165/s; Output: 174/s)
[2023-08-01 21:17:53 +0000] information/IdoMysqlConnection: Pending queries: 145 (Input: 152/s; Output: 141/s)
[2023-08-01 21:22:53 +0000] information/IdoMysqlConnection: Pending queries: 207 (Input: 180/s; Output: 161/s)
[2023-08-01 21:27:53 +0000] information/IdoMysqlConnection: Pending queries: 167 (Input: 194/s; Output: 180/s)
[2023-08-01 21:32:53 +0000] information/IdoMysqlConnection: Pending queries: 377 (Input: 176/s; Output: 139/s)
[2023-08-01 21:38:03 +0000] information/IdoMysqlConnection: Pending queries: 44 (Input: 159/s; Output: 177/s)
[2023-08-01 21:43:03 +0000] information/IdoMysqlConnection: Pending queries: 33 (Input: 138/s; Output: 160/s)
[2023-08-01 21:48:03 +0000] information/IdoMysqlConnection: Pending queries: 74 (Input: 174/s; Output: 187/s)
[2023-08-01 21:53:03 +0000] information/IdoMysqlConnection: Pending queries: 34 (Input: 149/s; Output: 165/s)
[2023-08-01 21:58:03 +0000] information/IdoMysqlConnection: Pending queries: 32 (Input: 145/s; Output: 158/s)
[2023-08-01 22:03:03 +0000] information/IdoMysqlConnection: Pending queries: 77 (Input: 146/s; Output: 157/s)
[2023-08-01 22:08:03 +0000] information/IdoMysqlConnection: Pending queries: 52 (Input: 161/s; Output: 181/s)
[2023-08-01 22:13:03 +0000] information/IdoMysqlConnection: Pending queries: 16 (Input: 142/s; Output: 154/s)
[2023-08-01 22:18:03 +0000] information/IdoMysqlConnection: Pending queries: 19 (Input: 166/s; Output: 204/s)
[2023-08-01 22:23:03 +0000] information/IdoMysqlConnection: Pending queries: 156 (Input: 152/s; Output: 169/s)
[2023-08-01 22:28:03 +0000] information/IdoMysqlConnection: Pending queries: 166 (Input: 178/s; Output: 194/s)
[2023-08-01 22:33:03 +0000] information/IdoMysqlConnection: Pending queries: 145 (Input: 144/s; Output: 159/s)
[2023-08-01 22:38:03 +0000] information/IdoMysqlConnection: Pending queries: 53 (Input: 158/s; Output: 186/s)
[2023-08-01 22:43:03 +0000] information/IdoMysqlConnection: Pending queries: 69 (Input: 181/s; Output: 202/s)
[2023-08-01 22:48:03 +0000] information/IdoMysqlConnection: Pending queries: 110 (Input: 178/s; Output: 197/s)
[2023-08-01 22:53:03 +0000] information/IdoMysqlConnection: Pending queries: 54 (Input: 171/s; Output: 192/s)

I don’t think its IDO. We also aren’t worried about the restart time - its about 20 seconds, which is fine.

I agree. It’s up to you whether to wait:

or to try this already:

We had no luck switching the memory allocator the memory still ended up growing until it crashed we have created a test icinga locally where I have been trying to debug and did tests with around 2-10k hosts and made a python script which I can put on here if you would like that just sent requests to icinga and it would make the memory usage grow however when I stopped sending the requests the memory usage wouldn’t go down and would just stay at what it was. We created backtraces and coredumps however they contain confidential information that I would prefer to not have online can we send you a next cloud link via PM to show you?

1 Like

Good catch!

Please share that Python script, the exact OS version and Icinga version. At best also Icinga config w/o confidential information, but able to reproduce that leak. Suggestion: replace each confidential string with an output from openssl rand -hex 16 or so.

Sure heres the script I was using https://nextcloud.sol1.net/s/6HcHbofNCoBYoLD and then the coredumps and backtraces are available here Sol1 Nextcloud

I think I’ve reproduced it. But it will take me a few days of letting my test system run and periodically checking the memory consumption. I’ll get back to you ASAP.

1 Like

Any progress on this side?

What does icinga2 daemon -C say?
Does disabling some features/components/checks/… -basically everything except the API load one by one- improve the situation and show a particular component/etc. which may have a side effect on the leak?
As we’re talking about a test env could you assign it some more memory to see whether it’s a “classic” memory leak or it just consumes a lot of memory from a particular peek on?
I mean 8GB isn’t very little, but also not very much.
Apropos. An indicator that memory hasn’t been leaked but just hardly fragmented is shrinking memory usage on systemctl stop icinga2. I.e. since some point it will consume less and less…

Meanwhile yet I can only recommend to reload Icinga daily in production so that it doesn’t hit any OOM.

Here is the daemon -C output (sanitised lightly)

root@PRODIcingaMon02:~# icinga2 daemon -C
[2023-08-14 06:14:14 +0000] information/cli: Icinga application loader (version: r2.14.0-1)
[2023-08-14 06:14:14 +0000] information/cli: Loading configuration file(s).
[2023-08-14 06:14:14 +0000] warning/config: Ignoring directory '/var/lib/icinga2/api/zones/PRODCLOUD_115PRD04VACM01' for unknown zone 'PRODCLOUD_115PRD04VACM01'.
[2023-08-14 06:14:14 +0000] warning/config: Ignoring directory '/var/lib/icinga2/api/zones/PRODCLOUD_115PRD04VMPP01' for unknown zone 'PRODCLOUD_115PRD04VMPP01'.
[2023-08-14 06:14:14 +0000] warning/config: Ignoring directory '/var/lib/icinga2/api/zones/PRODCLOUD_115PRD04VPOR01' for unknown zone 'PRODCLOUD_115PRD04VPOR01'.
[2023-08-14 06:14:14 +0000] warning/config: Ignoring directory '/var/lib/icinga2/api/zones/PRD04VICI01' for unknown zone 'PRD04VICI01'.
[2023-08-14 06:14:14 +0000] warning/config: Ignoring directory '/var/lib/icinga2/api/zones/PRD04VWUS01' for unknown zone 'PRD04VWUS01'.
[2023-08-14 06:14:14 +0000] information/ConfigItem: Committing config item(s).
[2023-08-14 06:14:14 +0000] information/ApiListener: My API identity: PRDP-PELDVIcingaMon02
[2023-08-14 06:14:16 +0000] warning/ApplyRule: Apply rule 'mail-icingaadmin' (in /etc/icinga2/conf.d/notifications.conf: 23:1-23:48) for type 'Notification' does not match anywhere!
[2023-08-14 06:14:16 +0000] warning/ApplyRule: Apply rule 'mail-icingaadmin' (in /etc/icinga2/conf.d/notifications.conf: 11:1-11:45) for type 'Notification' does not match anywhere!
[2023-08-14 06:14:16 +0000] warning/ApplyRule: Apply rule 'ssh' (in /etc/icinga2/conf.d/services.conf: 50:1-50:19) for type 'Service' does not match anywhere!
[2023-08-14 06:14:16 +0000] warning/ApplyRule: Apply rule '' (in /etc/icinga2/conf.d/services.conf: 60:1-60:65) for type 'Service' does not match anywhere!
[2023-08-14 06:14:16 +0000] warning/ApplyRule: Apply rule '' (in /etc/icinga2/conf.d/services.conf: 68:1-68:53) for type 'Service' does not match anywhere!
[2023-08-14 06:14:16 +0000] warning/ApplyRule: Apply rule 'Akamai Entrypoint Latency PATH A' (in /var/lib/icinga2/api/packages/director/26fa8d35-e292-417d-b57d-576c42a6b43e/zones.d/PRDP-PELDVIcingaMon02/service_apply.conf: 1:0-1:47) for type 'Service' does not match anywhere!
[2023-08-14 06:14:16 +0000] warning/ApplyRule: Apply rule 'SSH' (in /var/lib/icinga2/api/packages/director/26fa8d35-e292-417d-b57d-576c42a6b43e/zones.d/director-global/service_apply.conf: 20:1-20:19) for type 'Service' does not match anywhere!
[2023-08-14 06:14:16 +0000] warning/ApplyRule: Apply rule 'SNMP E5710 video lock' (in /var/lib/icinga2/api/packages/director/26fa8d35-e292-417d-b57d-576c42a6b43e/zones.d/director-global/service_apply.conf: 77:1-77:37) for type 'Service' does not match anywhere!
[2023-08-14 06:14:16 +0000] warning/ApplyRule: Apply rule 'cluster zone' (in /var/lib/icinga2/api/packages/director/26fa8d35-e292-417d-b57d-576c42a6b43e/zones.d/director-global/service_apply.conf: 132:1-132:28) for type 'Service' does not match anywhere!
[2023-08-14 06:14:16 +0000] warning/ApplyRule: Apply rule 'Dataminer Element Power Status' (in /var/lib/icinga2/api/packages/director/26fa8d35-e292-417d-b57d-576c42a6b43e/zones.d/director-global/service_apply.conf: 158:1-158:46) for type 'Service' does not match anywhere!
[2023-08-14 06:14:16 +0000] warning/ApplyRule: Apply rule 'Dataminer Element Access Switch DCM interfaces' (in /var/lib/icinga2/api/packages/director/26fa8d35-e292-417d-b57d-576c42a6b43e/zones.d/director-global/service_apply.conf: 167:1-167:62) for type 'Service' does not match anywhere!
[2023-08-14 06:14:16 +0000] warning/ApplyRule: Apply rule 'Dataminer Element Status' (in /var/lib/icinga2/api/packages/director/26fa8d35-e292-417d-b57d-576c42a6b43e/zones.d/director-global/service_apply.conf: 175:1-175:40) for type 'Service' does not match anywhere!
[2023-08-14 06:14:16 +0000] warning/ApplyRule: Apply rule 'Dataminer DCM_input_ts A Path - ' (in /var/lib/icinga2/api/packages/director/26fa8d35-e292-417d-b57d-576c42a6b43e/zones.d/director-global/service_apply.conf: 184:1-184:97) for type 'Service' does not match anywhere!
[2023-08-14 06:14:16 +0000] warning/ApplyRule: Apply rule 'Dataminer DCM_input_ts B Path - ' (in /var/lib/icinga2/api/packages/director/26fa8d35-e292-417d-b57d-576c42a6b43e/zones.d/director-global/service_apply.conf: 209:1-209:97) for type 'Service' does not match anywhere!
[2023-08-14 06:14:16 +0000] warning/ApplyRule: Apply rule 'Dataminer DCM_Output_LT_TS - ' (in /var/lib/icinga2/api/packages/director/26fa8d35-e292-417d-b57d-576c42a6b43e/zones.d/director-global/service_apply.conf: 220:1-220:45) for type 'Service' does not match anywhere!
[2023-08-14 06:14:16 +0000] warning/ApplyRule: Apply rule 'Dataminer Element Access Switch DCM Amazon interface' (in /var/lib/icinga2/api/packages/director/26fa8d35-e292-417d-b57d-576c42a6b43e/zones.d/director-global/service_apply.conf: 244:1-244:68) for type 'Service' does not match anywhere!
[2023-08-14 06:14:16 +0000] warning/ApplyRule: Apply rule 'Dataminer DCM_activation_peer' (in /var/lib/icinga2/api/packages/director/26fa8d35-e292-417d-b57d-576c42a6b43e/zones.d/director-global/service_apply.conf: 252:1-252:45) for type 'Service' does not match anywhere!
[2023-08-14 06:14:16 +0000] warning/ApplyRule: Apply rule 'Dataminer DCM_input_ts A Path - ' (in /var/lib/icinga2/api/packages/director/26fa8d35-e292-417d-b57d-576c42a6b43e/zones.d/director-global/service_apply.conf: 262:1-262:108) for type 'Service' does not match anywhere!
[2023-08-14 06:14:16 +0000] warning/ApplyRule: Apply rule 'Dataminer DCM_input_ts B Path - ' (in /var/lib/icinga2/api/packages/director/26fa8d35-e292-417d-b57d-576c42a6b43e/zones.d/director-global/service_apply.conf: 273:1-273:108) for type 'Service' does not match anywhere!
[2023-08-14 06:14:16 +0000] warning/ApplyRule: Apply rule 'Dataminer DCM_input_ts A Path - ' (in /var/lib/icinga2/api/packages/director/26fa8d35-e292-417d-b57d-576c42a6b43e/zones.d/director-global/service_apply.conf: 284:1-284:102) for type 'Service' does not match anywhere!
[2023-08-14 06:14:16 +0000] warning/ApplyRule: Apply rule 'Dataminer DCM_input_ts B Path - ' (in /var/lib/icinga2/api/packages/director/26fa8d35-e292-417d-b57d-576c42a6b43e/zones.d/director-global/service_apply.conf: 295:1-295:102) for type 'Service' does not match anywhere!
[2023-08-14 06:14:16 +0000] warning/ApplyRule: Apply rule 'Dataminer Element DCM alarms' (in /var/lib/icinga2/api/packages/director/26fa8d35-e292-417d-b57d-576c42a6b43e/zones.d/director-global/service_apply.conf: 306:1-306:44) for type 'Service' does not match anywhere!
[2023-08-14 06:14:16 +0000] warning/ApplyRule: Apply rule 'Windows NTP Time Status' (in /var/lib/icinga2/api/packages/director/26fa8d35-e292-417d-b57d-576c42a6b43e/zones.d/director-global/service_apply.conf: 428:1-428:39) for type 'Service' does not match anywhere!
[2023-08-14 06:14:16 +0000] warning/ApplyRule: Apply rule 'Windows Disk Status' (in /var/lib/icinga2/api/packages/director/26fa8d35-e292-417d-b57d-576c42a6b43e/zones.d/director-global/service_apply.conf: 436:1-436:35) for type 'Service' does not match anywhere!
[2023-08-14 06:14:16 +0000] warning/ApplyRule: Apply rule 'Check Disk Space' (in /var/lib/icinga2/api/packages/director/26fa8d35-e292-417d-b57d-576c42a6b43e/zones.d/director-global/service_apply.conf: 444:1-444:32) for type 'Service' does not match anywhere!
[2023-08-14 06:14:16 +0000] warning/ApplyRule: Apply rule 'Check NLA config correct' (in /var/lib/icinga2/api/packages/director/26fa8d35-e292-417d-b57d-576c42a6b43e/zones.d/director-global/service_apply.conf: 452:1-452:40) for type 'Service' does not match anywhere!
[2023-08-14 06:14:16 +0000] warning/ApplyRule: Apply rule 'Check Windows Updates' (in /var/lib/icinga2/api/packages/director/26fa8d35-e292-417d-b57d-576c42a6b43e/zones.d/director-global/service_apply.conf: 461:1-461:37) for type 'Service' does not match anywhere!
[2023-08-14 06:14:16 +0000] warning/ApplyRule: Apply rule '' (in /var/lib/icinga2/api/packages/director/26fa8d35-e292-417d-b57d-576c42a6b43e/zones.d/director-global/service_apply.conf: 486:1-486:53) for type 'Service' does not match anywhere!
[2023-08-14 06:14:16 +0000] warning/ApplyRule: Apply rule '' (in /var/lib/icinga2/api/packages/director/26fa8d35-e292-417d-b57d-576c42a6b43e/zones.d/director-global/service_apply.conf: 496:1-496:53) for type 'Service' does not match anywhere!
[2023-08-14 06:14:16 +0000] warning/ApplyRule: Apply rule 'Dataminer DCM_input_ts A Path - ' (in /var/lib/icinga2/api/packages/director/26fa8d35-e292-417d-b57d-576c42a6b43e/zones.d/director-global/service_apply.conf: 506:1-506:102) for type 'Service' does not match anywhere!
[2023-08-14 06:14:16 +0000] warning/ApplyRule: Apply rule 'Dataminer DCM_input_ts B Path - ' (in /var/lib/icinga2/api/packages/director/26fa8d35-e292-417d-b57d-576c42a6b43e/zones.d/director-global/service_apply.conf: 517:1-517:102) for type 'Service' does not match anywhere!
[2023-08-14 06:14:16 +0000] warning/ApplyRule: Apply rule 'Akamai Entrypoint Latency PATH B' (in /var/lib/icinga2/api/packages/director/26fa8d35-e292-417d-b57d-576c42a6b43e/zones.d/PRDP-PELDVIcingaMon02/service_apply.conf: 15:1-15:48) for type 'Service' does not match anywhere!
[2023-08-14 06:14:16 +0000] information/ConfigItem: Instantiated 6 NotificationCommands.
[2023-08-14 06:14:16 +0000] information/ConfigItem: Instantiated 378 Notifications.
[2023-08-14 06:14:16 +0000] information/ConfigItem: Instantiated 1 IcingaApplication.
[2023-08-14 06:14:16 +0000] information/ConfigItem: Instantiated 1953 Hosts.
[2023-08-14 06:14:16 +0000] information/ConfigItem: Instantiated 1384 HostGroups.
[2023-08-14 06:14:16 +0000] information/ConfigItem: Instantiated 1 Downtime.
[2023-08-14 06:14:16 +0000] information/ConfigItem: Instantiated 63 Comments.
[2023-08-14 06:14:16 +0000] information/ConfigItem: Instantiated 1 IdoMysqlConnection.
[2023-08-14 06:14:16 +0000] information/ConfigItem: Instantiated 1 FileLogger.
[2023-08-14 06:14:16 +0000] information/ConfigItem: Instantiated 40 Zones.
[2023-08-14 06:14:16 +0000] information/ConfigItem: Instantiated 1 CheckerComponent.
[2023-08-14 06:14:16 +0000] information/ConfigItem: Instantiated 38 Endpoints.
[2023-08-14 06:14:16 +0000] information/ConfigItem: Instantiated 11 ApiUsers.
[2023-08-14 06:14:16 +0000] information/ConfigItem: Instantiated 1 NotificationComponent.
[2023-08-14 06:14:16 +0000] information/ConfigItem: Instantiated 1 ApiListener.
[2023-08-14 06:14:16 +0000] information/ConfigItem: Instantiated 328 CheckCommands.
[2023-08-14 06:14:16 +0000] information/ConfigItem: Instantiated 5 TimePeriods.
[2023-08-14 06:14:16 +0000] information/ConfigItem: Instantiated 3 UserGroups.
[2023-08-14 06:14:16 +0000] information/ConfigItem: Instantiated 111 Users.
[2023-08-14 06:14:16 +0000] information/ConfigItem: Instantiated 6625 Services.
[2023-08-14 06:14:16 +0000] information/ConfigItem: Instantiated 707 ServiceGroups.
[2023-08-14 06:14:16 +0000] information/ConfigItem: Instantiated 1 ScheduledDowntime.
[2023-08-14 06:14:16 +0000] information/ScriptGlobal: Dumping variables to file '/var/cache/icinga2/icinga2.vars'
[2023-08-14 06:14:16 +0000] information/cli: Finished validating the configuration file(s).
root@PRDP-PELDVIcingaMon02:~# 

We don’t really have scope to see if we can disable features, we are running at bare minimum in prod right now.
Our test system we can let it run and have more and more memory until it OOMs out. No amount of memory is enough, we got it to 20GB in testing.
I have realised now why this problem cropped up - we had an error in a director sync rule for a while and no-one noticed, which meant Icinga was effectively restarting less to do its deploys. So it appears the culprit is heavy API load from Meerkat v2, which we are working on switching to v3, and will solve these problems. However the issue remains - Icinga2 shouldn’t really leak memory under heavy API load, so if there is anything else I can do to assist, please let us know. Omar and I can work together on it. @omarsol1

I meant on the test system.

I don’t quite understand, especially the connection between Director and Meerkat.

Ah the connection was that we have been running meerkat with this config for about a year or so, and then the Ooms started happening around the start of July. Which is due to icinga not restarting regularly, as the director sync got broken around then. So the director applying config changes automatically (from netbox) meant the meerkat causing memory leak issue was masked. Director sync stopped due to bad data from netbox, and then meerkat caused memory leak to cause Ooms.

I hope that makes sense.

1 Like

I have thought about all this and this is the result:

  • The Director sync seems broken in the first place, I’d just fix it and if the other problem goes away – great.
  • Apropos. Strictly speaking Meerkat is DoS-ing the Icinga 2 API. But yes, you already said that either.
  • Especially the latter fact makes me thinking whether authorised API users should be limited only on what they can do and where or an additional optional limitation on how frequently would be appropriate. Maybe even 429 and a response delay at the admin’s option. CC @jbrost

Maybe we’ll discover even more together, sooner or later:

Do you think that would help more than reducing the rate at which memory is leaked?

If this is indeed cause by HTTP requests, this suggest an actual memory leak somewhere as those should not increase memory usage in the long term (unless of course it’s an API call that’s supposed to add information that’s intended to be kept, like creating new objects).

@davekempe @omarsol1 Apropos test system, does lowering the request rate prevent the OOM like on my system? Not like less requests/s = slower OOM, but like less requests/s = no OOM at all?

This would confirm my “DoS” hypothesis.

Also, on my system the memory usage doesn’t go down instantly during Icinga stop after memory leak. But it goes down. This hints that the memory isn’t “classically” leaked.

Hello all,

we are also facing a memory leak on our icinga setup:

Our icinga2 version also ist 2.14.0 but we saw this behavior also before updating to this version and believed the update would solve it, which was not the case.

We have a distributed setup with 2 masters and 4 satellites and are using the IDO.
Please see the below stats for further insights:
image
image
image
The passive check count for services is incorrect for some reason, we have lots of passive service checks in our monitoring but i do not know how to filter for the correct amount. If the number is needed, please guide me on how to create a filter for the correct amount. I would guess it is somewhere around a few hundred to a thousand passive service checks.

Can someone point us in the right direction or provide insight in how to solve this issue?

@Al2Klimov @jbrost FYI, maybe this helps you to get more insight, i can give more informations if needed.

Best regards
Michel

Hi Michel,

we need at least the output of icinga2 daemon -C as well as logs telling the items and rate of queues. Also the hardware specs of course and Icinga’s crash/reload frequency.

Best,
A/K

Sure thing, here are the requested informations:

Output of icinga2 daemon -C:

# icinga2 daemon -C
[2023-08-23 14:16:32 +0200] information/cli: Icinga application loader (version: r2.14.0-1)
[2023-08-23 14:16:32 +0200] information/cli: Loading configuration file(s).
[2023-08-23 14:16:32 +0200] information/ConfigItem: Committing config item(s).
[2023-08-23 14:16:32 +0200] information/ApiListener: My API identity: <REDACTED>

# here were about 290 warnings regarding apply rules for services and notifications, they are present but not used, which should not be a problem regarding memory in my understanding

[2023-08-23 14:16:41 +0200] information/ConfigItem: Instantiated 1 NotificationComponent.
[2023-08-23 14:16:41 +0200] information/ConfigItem: Instantiated 4 EventCommands.
[2023-08-23 14:16:41 +0200] information/ConfigItem: Instantiated 1 IdoMysqlConnection.
[2023-08-23 14:16:41 +0200] information/ConfigItem: Instantiated 941 Comments.
[2023-08-23 14:16:41 +0200] information/ConfigItem: Instantiated 1 CheckerComponent.
[2023-08-23 14:16:41 +0200] information/ConfigItem: Instantiated 118 Users.
[2023-08-23 14:16:41 +0200] information/ConfigItem: Instantiated 60 UserGroups.
[2023-08-23 14:16:41 +0200] information/ConfigItem: Instantiated 38 TimePeriods.
[2023-08-23 14:16:41 +0200] information/ConfigItem: Instantiated 26 ServiceGroups.
[2023-08-23 14:16:41 +0200] information/ConfigItem: Instantiated 1282 Zones.
[2023-08-23 14:16:41 +0200] information/ConfigItem: Instantiated 23728 Services.
[2023-08-23 14:16:41 +0200] information/ConfigItem: Instantiated 251 ScheduledDowntimes.
[2023-08-23 14:16:41 +0200] information/ConfigItem: Instantiated 21 NotificationCommands.
[2023-08-23 14:16:41 +0200] information/ConfigItem: Instantiated 8857 Notifications.
[2023-08-23 14:16:41 +0200] information/ConfigItem: Instantiated 1 FileLogger.
[2023-08-23 14:16:41 +0200] information/ConfigItem: Instantiated 1 IcingaApplication.
[2023-08-23 14:16:41 +0200] information/ConfigItem: Instantiated 2723 Hosts.
[2023-08-23 14:16:41 +0200] information/ConfigItem: Instantiated 282 HostGroups.
[2023-08-23 14:16:41 +0200] information/ConfigItem: Instantiated 1282 Endpoints.
[2023-08-23 14:16:41 +0200] information/ConfigItem: Instantiated 232 Downtimes.
[2023-08-23 14:16:41 +0200] information/ConfigItem: Instantiated 20005 Dependencies.
[2023-08-23 14:16:41 +0200] information/ConfigItem: Instantiated 13 ApiUsers.
[2023-08-23 14:16:41 +0200] information/ConfigItem: Instantiated 1 ApiListener.
[2023-08-23 14:16:41 +0200] information/ConfigItem: Instantiated 479 CheckCommands.
[2023-08-23 14:16:41 +0200] information/ConfigItem: Instantiated 1 GraphiteWriter.
[2023-08-23 14:16:41 +0200] information/ScriptGlobal: Dumping variables to file '/var/cache/icinga2/icinga2.vars'
[2023-08-23 14:16:41 +0200] information/cli: Finished validating the configuration file(s).


Ido Pending Queries:
The average seems to be between 500 - 600 pending queries, an Input rate between 80 an 100 per second and an output rate betweeen 40 - 40 per second.
See the below log entry for a typical one:

[2023-08-23 11:36:53 +0200] information/IdoMysqlConnection: Pending queries: 565 (Input: 87/s; Output: 42/s)


RelayQueue Rates:
Now this is where it gets interesting.
The rates seem to be horrible in my understanding.
See the following lines for up to date entries regarding this:


[2023-08-23 14:27:02 +0200] information/WorkQueue: #7 (ApiListener, RelayQueue) items: 3500824, rate: 0.0166667/s (1/min 18154/5min 66270/15min); empty in 2 hours, 23 minutes and 25 seconds
[2023-08-23 14:27:13 +0200] information/WorkQueue: #7 (ApiListener, RelayQueue) items: 3505178, rate: 0.0333333/s (2/min 18155/5min 66271/15min); empty in 2 hours, 38 minutes and 26 seconds
[2023-08-23 14:27:25 +0200] information/WorkQueue: #7 (ApiListener, RelayQueue) items: 3509305, rate: 0.0166667/s (1/min 18155/5min 66270/15min); empty in 2 hours, 48 minutes and 38 seconds
[2023-08-23 14:27:37 +0200] information/WorkQueue: #7 (ApiListener, RelayQueue) items: 3513528, rate: 0.0166667/s (1/min 18155/5min 66270/15min); empty in 2 hours, 44 minutes and 49 seconds
[2023-08-23 14:27:49 +0200] information/WorkQueue: #7 (ApiListener, RelayQueue) items: 3517875, rate: 0.0166667/s (1/min 18155/5min 66270/15min); empty in 2 hours, 40 minutes and 50 seconds
[2023-08-23 14:28:01 +0200] information/WorkQueue: #7 (ApiListener, RelayQueue) items: 3514005, rate: 133.317/s (7999/min 20900/5min 74268/15min); empty in less than 1 millisecond
[2023-08-23 14:28:13 +0200] information/WorkQueue: #7 (ApiListener, RelayQueue) items: 3518626, rate: 133.3/s (7998/min 20900/5min 74268/15min); empty in 2 hours, 30 minutes and 49 seconds
[2023-08-23 14:28:25 +0200] information/WorkQueue: #7 (ApiListener, RelayQueue) items: 3523114, rate: 133.3/s (7998/min 20900/5min 64307/15min); empty in 2 hours, 36 minutes and 50 seconds
[2023-08-23 14:28:37 +0200] information/WorkQueue: #7 (ApiListener, RelayQueue) items: 3527338, rate: 133.317/s (7999/min 13853/5min 64308/15min); empty in 2 hours, 46 minutes and 9 seconds
[2023-08-23 14:28:49 +0200] information/WorkQueue: #7 (ApiListener, RelayQueue) items: 3531144, rate: 133.317/s (7999/min 13853/5min 64308/15min); empty in 3 hours, 3 minutes and 45 seconds
[2023-08-23 14:29:01 +0200] information/WorkQueue: #7 (ApiListener, RelayQueue) items: 3535211, rate: 0.0166667/s (1/min 13853/5min 56672/15min); empty in 2 hours, 51 minutes and 59 seconds
[2023-08-23 14:29:13 +0200] information/WorkQueue: #7 (ApiListener, RelayQueue) items: 3539809, rate: 0.0166667/s (1/min 13853/5min 56672/15min); empty in 2 hours, 33 minutes and 26 seconds
[2023-08-23 14:29:25 +0200] information/WorkQueue: #7 (ApiListener, RelayQueue) items: 3544013, rate: 0.0333333/s (2/min 13814/5min 56673/15min); empty in 2 hours, 47 minutes and 44 seconds
[2023-08-23 14:29:37 +0200] information/WorkQueue: #7 (ApiListener, RelayQueue) items: 3548420, rate: 0.0166667/s (1/min 13814/5min 56673/15min); empty in 2 hours, 42 minutes and 12 seconds

This is not persistent though, there are times in the logs, were the queue only hold a few hundred or thousand items and says its empty in less than 1 millisecond:

[2023-08-23 10:25:20 +0200] information/WorkQueue: #7 (ApiListener, RelayQueue) items: 1336, rate: 324.083/s (19445/min 95105/5min 95105/15min); empty in less than 1 millisecond

There are also entries where it complains that the task handler is not able to keep up:

[2023-08-23 08:59:20 +0200] information/WorkQueue: #7 (ApiListener, RelayQueue) items: 15361348, rate: 0.0166667/s (1/min 4602/5min 15134/15min); empty in infinite time, your task handler isn't able to keep up

Overall the rate seems to not be constantly overwhelmed, but most of the time it seems.
There definetly seems to be an issue where icinga is not able to clear this queue fast enough, could this be related to the issue and/or could this lead to other issues as well?


Hardware Specs
16 CPUs @ 2.80GHz, 64 GB RAM, 650.0 GB Storage


Icinga Crash/Reload Frequency
We started observing this problem since around february this year, as you can see in this graph:

I can however not find any immediate cause for this since the last icinga update before this was on 16. january 2023 from 2.13.5 to 2.13.6 and the next update after this was in march 2023 to 2.13.7.

The general crash/reload frequency is about 2 times per week, which sometimes causes the service to not fully recover, which is of course no good for our production environment.

Edit
I hope this helps to better pinpoint the underlying problem.
If you need any other informations i will gladly provide it, thanks for looking into it @Al2Klimov :+1:

1 Like

Could you also provide a graph of num_json_rpc_relay_queue_items and one of num_json_rpc_relay_queue_item_rate from the icinga check (for us to get a big picture)?

Also, what’s the requests/t rate on the Icinga API?

@Al2Klimov i just noticed that we did not have the icinga health check running yet for the masters.
I just configured it and will provide graphs as soon as enough data has been collected.

As for the requests/s rate of the API, is there any built in feature of Icinga to read this or do i need to scrape this from the webserver logs?

If i need to scrape this info from the logs, do you maybe have any suggestions where/what to look for and how to effectively get the information?