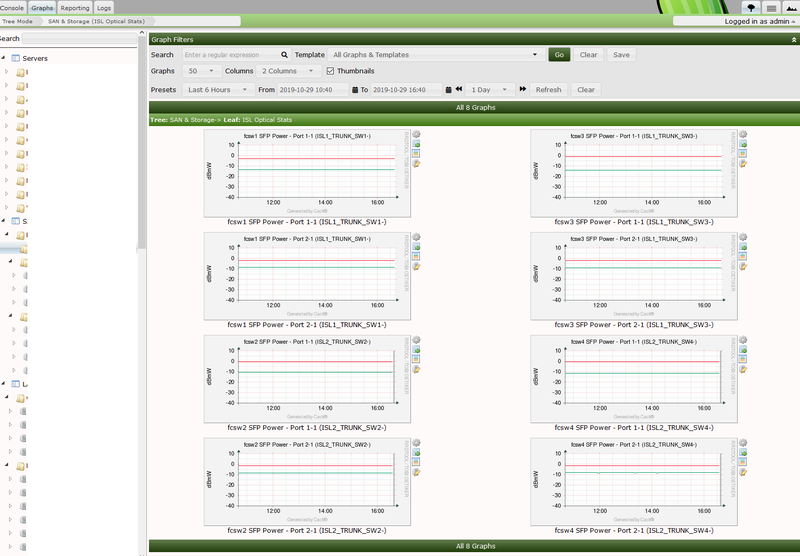
If you needed a similar GUI to display performance data collected by Icinga, what would you use?
The main thing is that you can create a custom multi-level tree and place objects therein. Usually that would be hosts, which, when you click on them display their available graphs on the right-hand side. Additionally you can filter which graphs/services exactly to display (and the timeframe) at the top of the screen.
This need not be 100% identical, but certainly something like that must exist!? What would you use?
I am not aware of any frontend that provides this kind of view. Neither the old classic-ui nor icingaweb2.
Tbh, I am not sure if this is possible with custom themes / views / templates or a custom module in icinga2 and I let this to the guys with more experience in frontend module development.
Did you try Grafana? The layout would be a bit different but you could create dashboards, organize them into folders and people can create their own dashboards to have exactly the view they want.
The Business Processes module may be able to what you want, but I second what Marcel has suggested - Grafana with folders and templates is probably the best way to go.
You can use the grafana module for icingaweb2 to show one or more graphs.
The recommended way is to collect performance data with each service check (i.e. with check_snmp_interface, check_mk or similar scripts) and write them in a backend DB.
There are several backends like influxdb, elasticsearch or pnp4nagios/rrd available.
Graphs are generated by grafana with data from backend, the icingaweb2 module grafana inserts graphs in icingaweb2 service views based on hostname, checkname and additional parameters.
@winem
Hi Marcel,
I’m pushing performance data to graphite and I’m using grafana where I use graphite as datasource.
But I’m really struggling with grafana because there is not really a tree view.
For example, I got 70 switches where I monitor every single port (bandwitdh).
Is there any possibility to create different folders, for example:
“Switches”
“Windows Server”
“Linux Server”
and put the specific hosts into that folders?
@holobolo0815, do you have to see all the graphs at the same time? Usually the number of graphs shown on a single screen are quite limited.
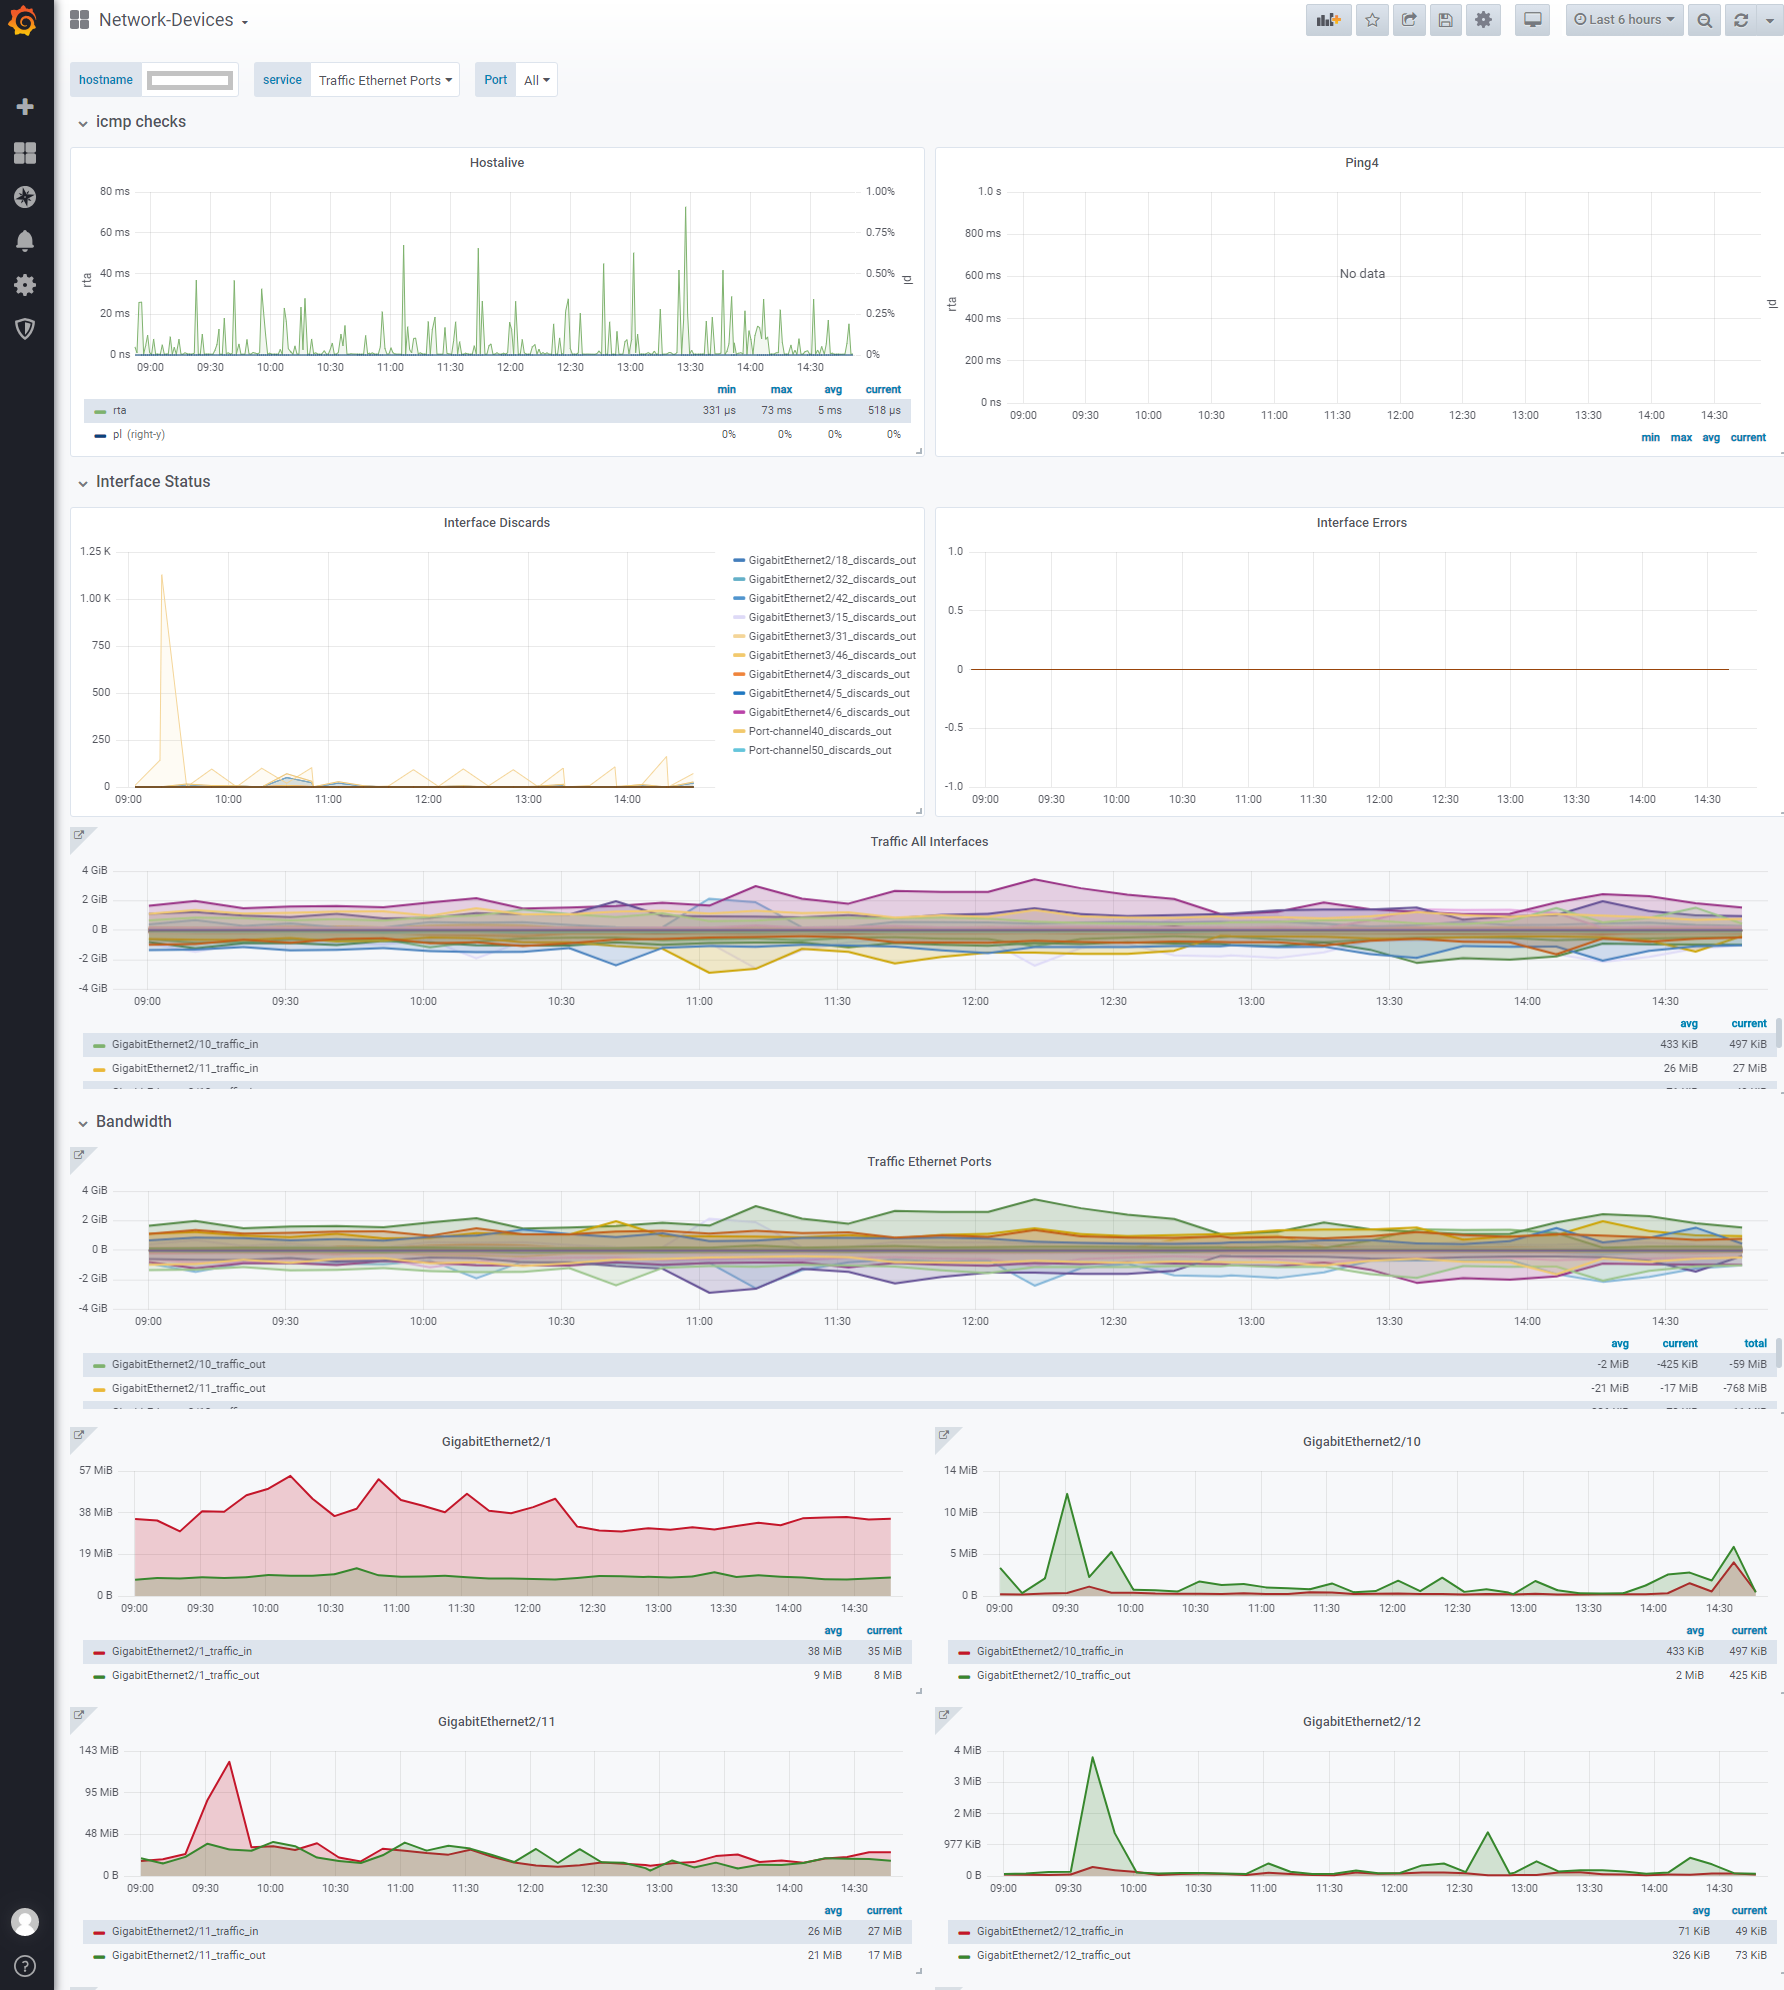
What you could do is to use query variables for the dashboard. This allows you to define a graphite or influx query for example to fetch all switches, linux and windows hosts based on tags or regex and put a dropdown at the top of the dashboard where you can select the host you want (or all).
You can also create a single graph for a switch metric or a dashboard or row for a switch and repeat that for each value chosen from the drop down.
@Axel577 It doesn’t really make sense to need to maintain two separate tools that do in fact the same thing (including polling everything twice, consuming disk space twice, etc.). It should be possible to streamline this into one tool. It would be best if that tool was Icinga.
The point is that in Cacti you add a Host to the treeview, and when you click on that host, you automatically get all the graphs pertaining to that host properly lined up in several columns (configurable) on the right hand side of the screen. That part of the screen also contains a filter at the top that allows to more selectively show only certain graphs concerning that host.
@dnsmichi
cacti isn’t really a monitoring system, it’s a graphing tool. You wouldn’t use cacti as a pure monitoring system with alerts and so on.
@unic
That looks interesting! How do your variables for “hostname”, “service” and “Port” look like? Would you share that information?
@holobolo0815
Yes exactly. Currently we are using icinga2 and cacti together but as you said you have to maintain two systems. Would be indeed really nice to have such a feature in icinga with a tree view like in cacti. I mean, the data/metrics are stored in icinga so we would in theorie just need a GUI/ extension of icingaweb2.
Its still a litte bit in development and not absolutly clean. We are using the nwc check and as we have a lot of switches and this check needs a lot of ressources, so we decided to collect all interfaces in one run so all interfaces are in one service. Data is collected in an influxdb.
Hostname:
SHOW TAG VALUES WITH KEY = "hostname" where type =~ /switch|router|firewall/
SERVICE:
SHOW TAG VALUES from iftraffic64_alias,nwc_health_longtimeout WITH KEY = "service" where hostname =~ /$hostname/ AND service =~ /Traffic.*/ OR hostname =~ /$hostname/ AND service =~ /Uplink.*/
Port:
SHOW TAG VALUES from iftraffic64_alias,nwc_health_longtimeout WITH KEY = "metric" where hostname =~ /$hostname/ AND service =~ /$service/
I’ve used Cacti in my previous job, you can use it as a standalone tool. Especially for SNMP polling, it really is good. Problem is the slow development and latency in reaction to security issues.
Still, we now have Grafana, InfluxDB, etc. - I wouldn’t bet anything on Cacti these days.