@gkoutsog
Do you currently use the grafana plugin?
Yes and it is quite good!
Do you use icingaweb2 2.7.3 and grafana v6.4.4? Because it says “if you want to use Grafana 5, enable this option”. I’m wondering if the pluign is compatible with version 6.
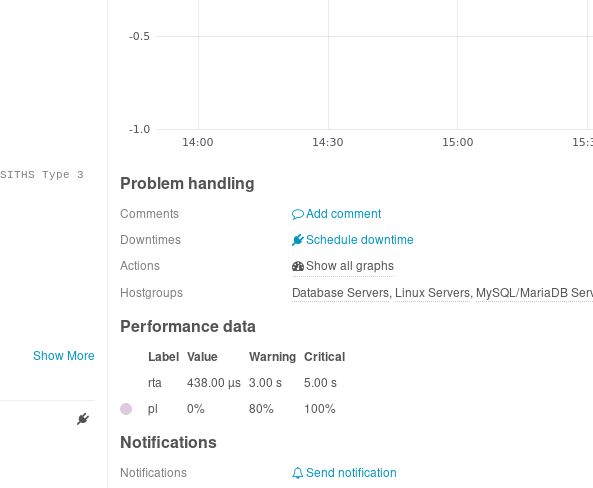
And maybe you can tell me how do I get the performance graphs shown at a service in icingaweb:
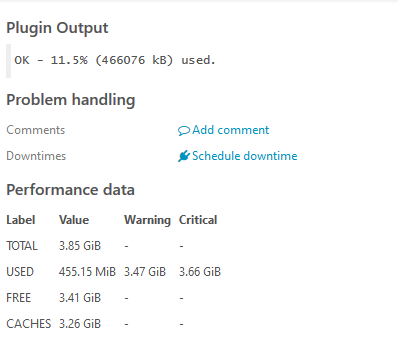
That’s the memory check of a linux server.
Does that automatically appear after doing the basic configuration in /etc/icingaweb2/modules/grafana/config.ini ?
Thank you.
The module is compatible with Grafana 5 and 6 and latest versions of IcingaWeb2. It is actively developed and latest version is from September 2019.
It is visible in the host tab, under Actions, not in a service tab.
Have you read the documentation of the module?
You probably need to figure out the Grafana dashboard UID and then install the included dashboards.
But make sure that Grafana is working first and that performance data gets collected.
/George
1 Like
Hi Georg,
I’ve read the documentation but I’m struggling with the configuration of:
Default dashboard
Default dashboard UID
and
Default panel id.
What is meant by “default”?
I set up 50 different dashboards, one for 48port switches, one for 24port switches, one for linux server and so on.
In each dashboard, there are 10 or more panels.
So I don’t understand what to configure above.
Hi,
I am guessing that Grafana is working as it should, since you already have custom dashboards.
- default-dashboard: Is usually usually “icinga2-default” but that you need to import manually.
- UID: this comes from the url when you log in to Grafana web http://server.xyz:3000/Z/XXXXXX/icinga2-default
- Panel ID: usually 1 but if you are not getting anything try with other numbers too.
Cheers,
George
I am guessing that Grafana is working as it should, since you already have custom dashboards.
Exactly, grafana is working as it should.
default-dashboard: Is usually usually “icinga2-default” but that you need to import manually.
Manually import from where?
From https://grafana.com/grafana/dashboards/56 ?
But another general question to the plugin because I don’t understand how it works:
The default dashboard “icinga2-default”: What is the purpose of that dashboard? Do I have to set up >1000 panels for every host I got in icinga2 to get the performance graphs?
Or is the plugin able to look into all of my dashboards?
Because I don’t understand why the plugin doesn’t look into the graphite database and visualize the data. I mean, all metrics are stored in graphite with according hostname and servicename.
The dashboards are located at ‘/usr/share/icingaweb2/modules/grafana/dashboards/’ or wherever you installed the grafana plugin. Also check here .
It actually works like you want it to. It aggregates data from Graphite and you only have to import it once and configure it. No panels to setup. @anon66228339, the author, can explain it better. Then the graphs appear automatically.
Cheers,
George
Hi George,
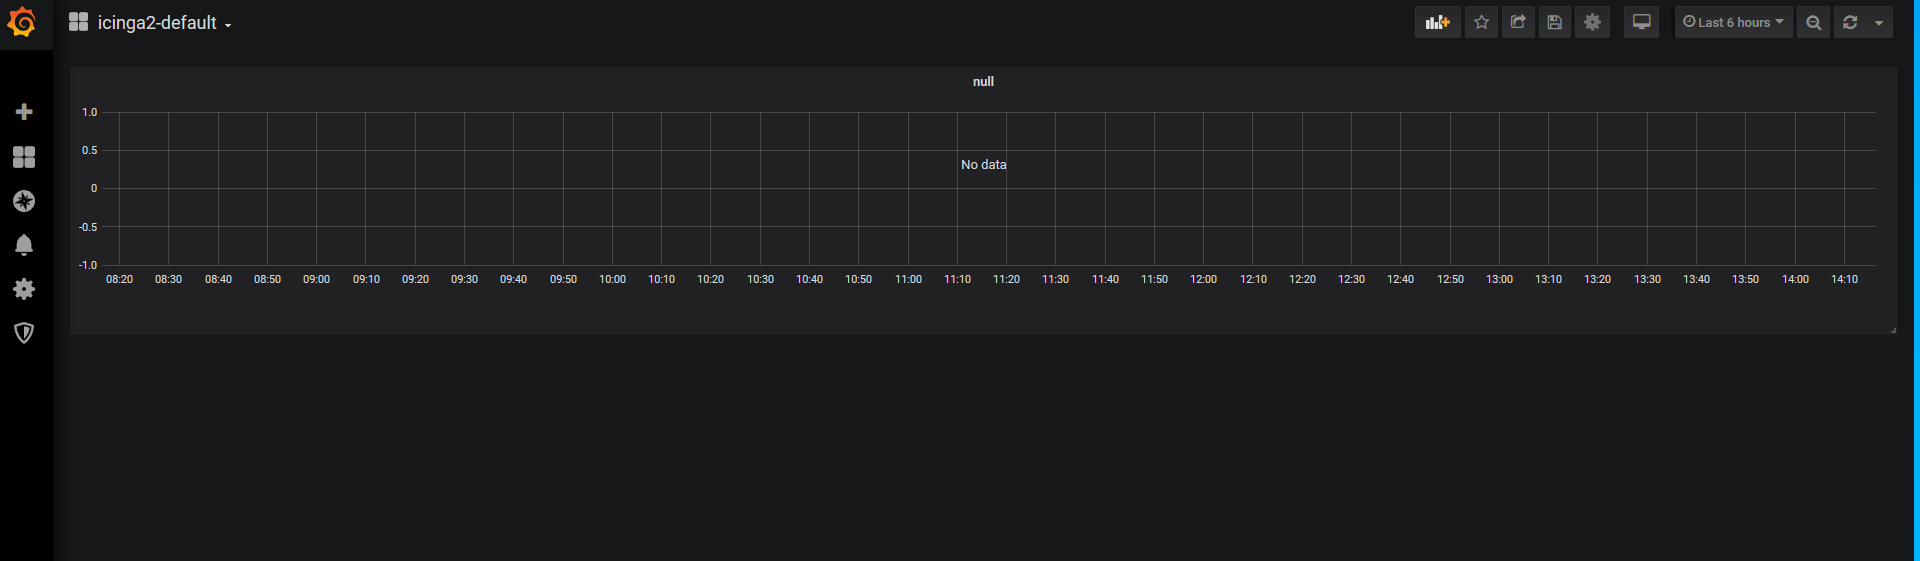
I imported icinga2-default.json into Grafana but I don’t get anything:
Futhermore, I don’t understand the configuration of the variables:
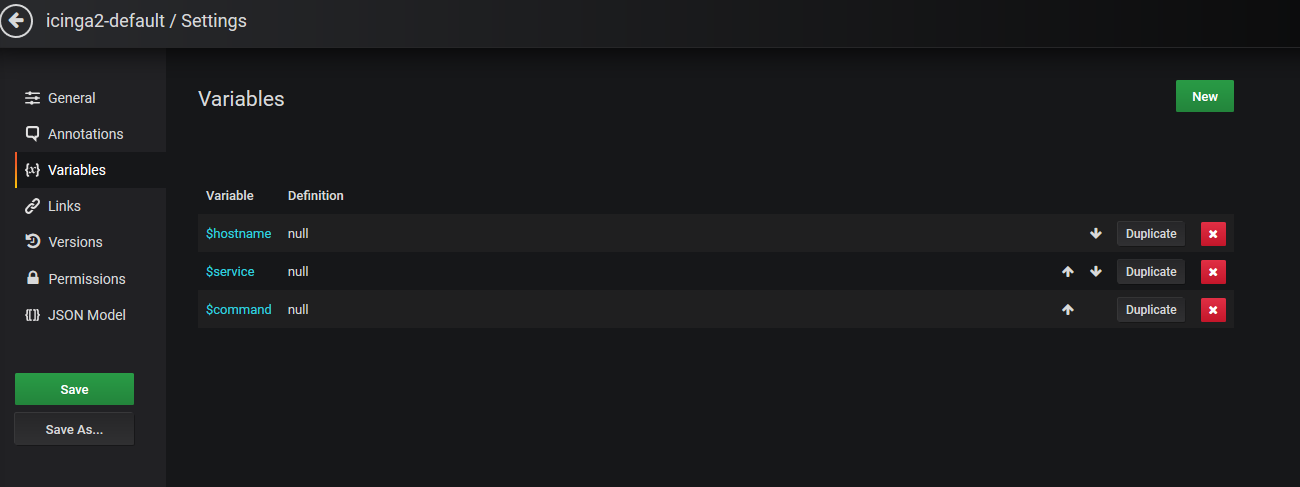
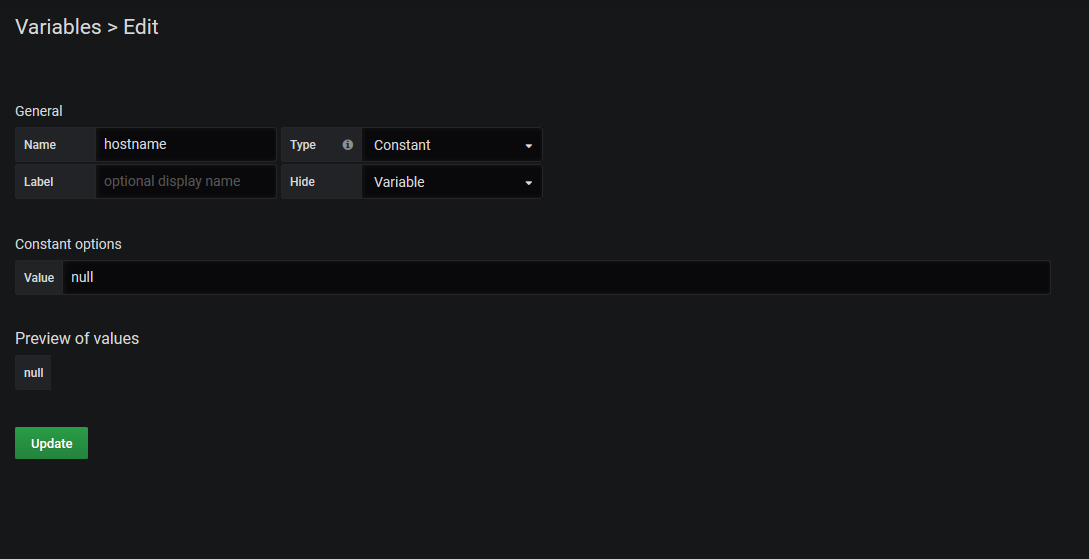
Is “null” as constant value correct?
That’s ok. Now you need to test your IcingaWeb2 configuration.
Go to Configuration -> Modules -> Grafana and fill in the right values for your instance.
Cheers,
George
Don’t care about the icinga2-default dashboard in grafana.
It’s solely purpose is to provide graphs for the icingaweb2 module. The variables are all provided by the module once a graph is loaded.
1 Like
Unfortunately, I don’t get it working. I only get a blank graph:
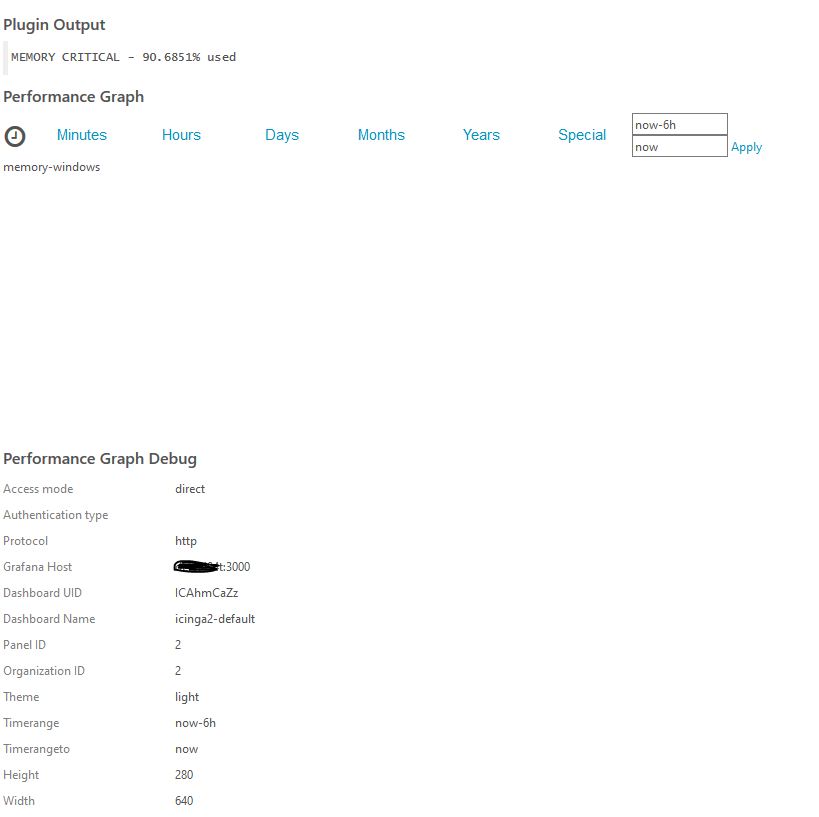
Is there any debugging I could do? I enabled debug in the config but I don’t see any entries in /var/log/icinga2/debug.log
My confiuguration:
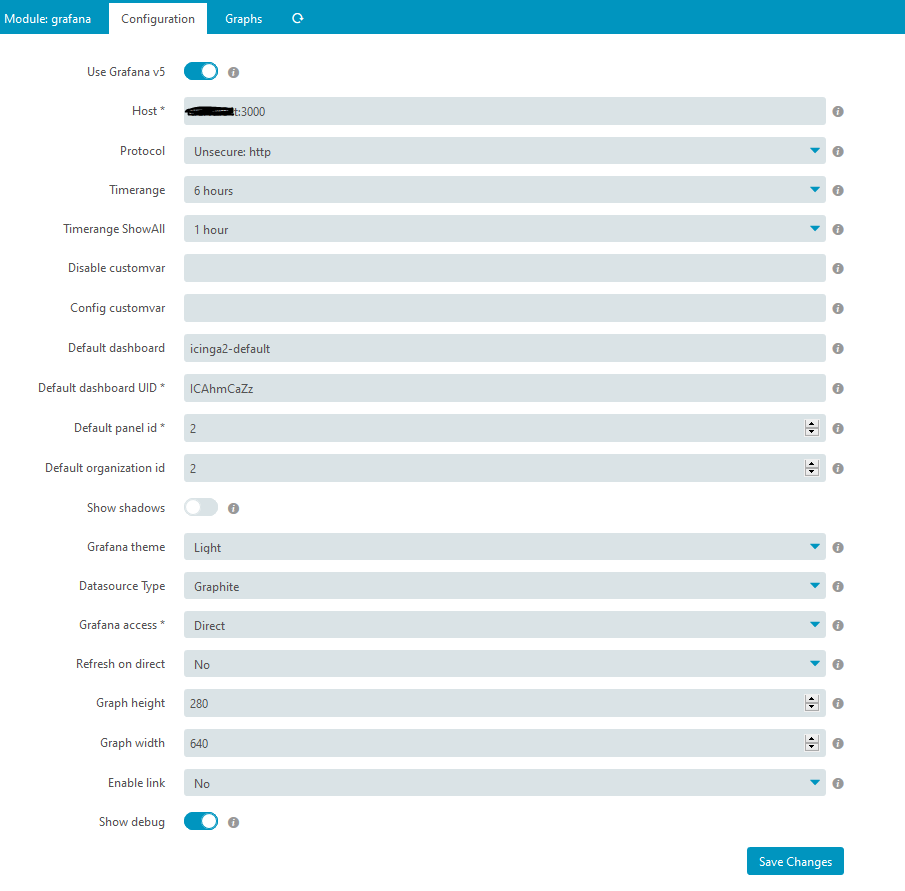
I suggest to switch “Enable Link” to yes (next to last option) and then try and click at the empty space where the graph would be. It will try to open up Grafana and fail of course but from the URL itself you should be able to understand which parameters are wrong.
Cheers,
George
Also, direct mode like you have chosen requires auth.anonymous enabled in Grafana.
Do you have that configured?
Hi George,
thank for that hint with the URL. I got it working. I had to change panel id and organization id.
But now there is another problem. For example when I take a look at the memory check:
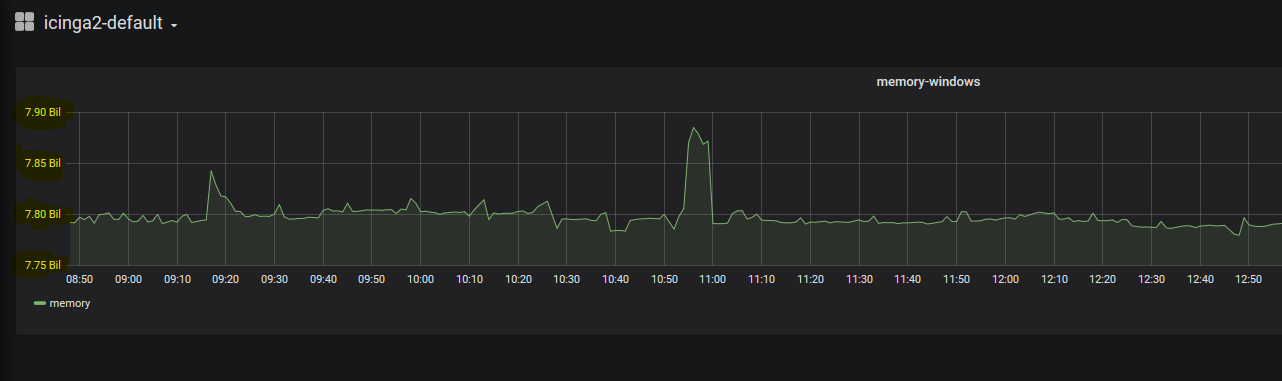
Unit at the Y-axes is Misc -> “short”:
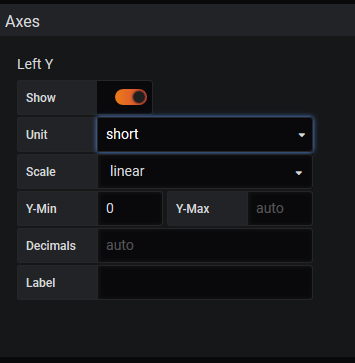
So values are in billions. So I went to that URL and changed the unit to “bytes”.
Now it shows GB:
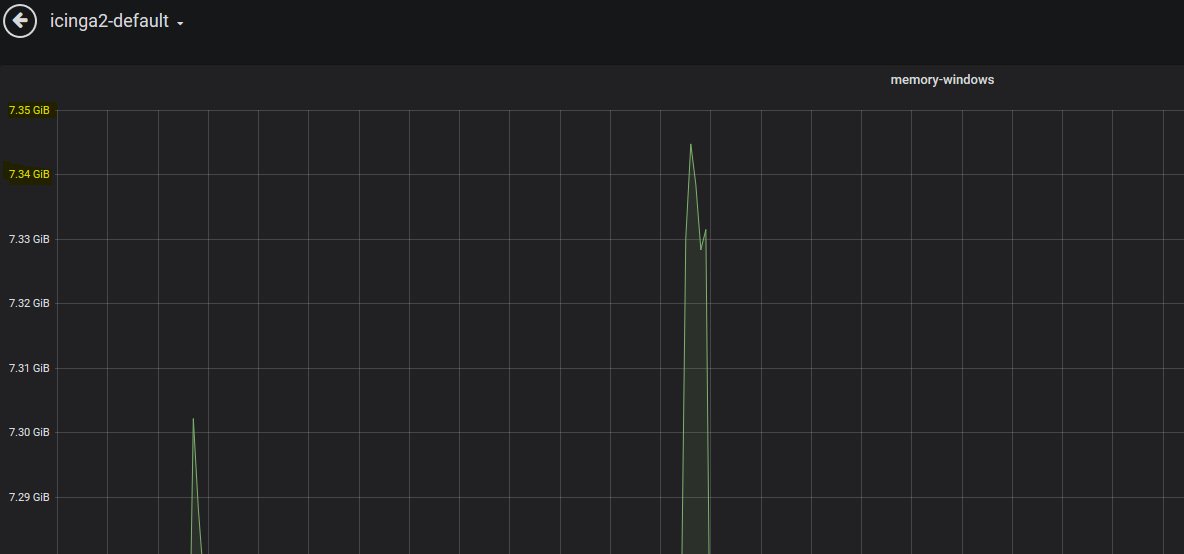
But I noticed that now every graph appears with unit “bytes” (cpu check, ping check…). Is there any way to solve that?
1 Like
That is a known problem afaik but cant be solved easily or at all right now.
On the other hand, this is just a plugin for having the graphs embedded in Icinga and the generic units should be ok. In real dashboards like you have already built, unit accuracy is set per graph.
/George
1 Like
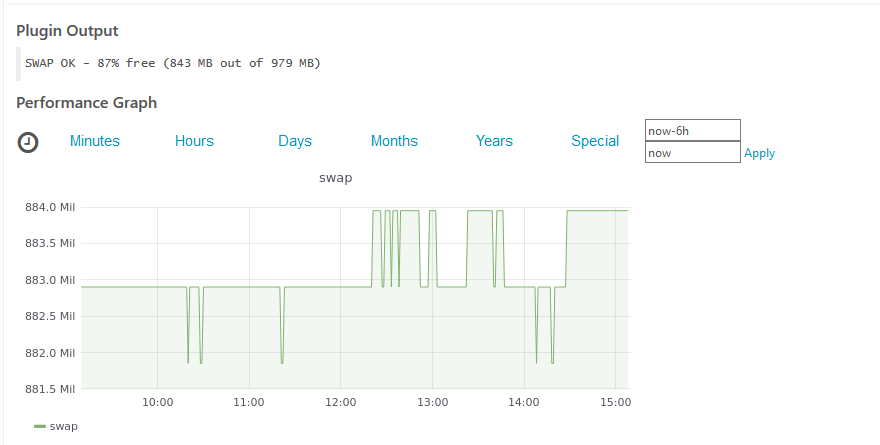
Too bad!
Because for example swap graphs looks like that:
in my custom grafana graphs, it looks like that:
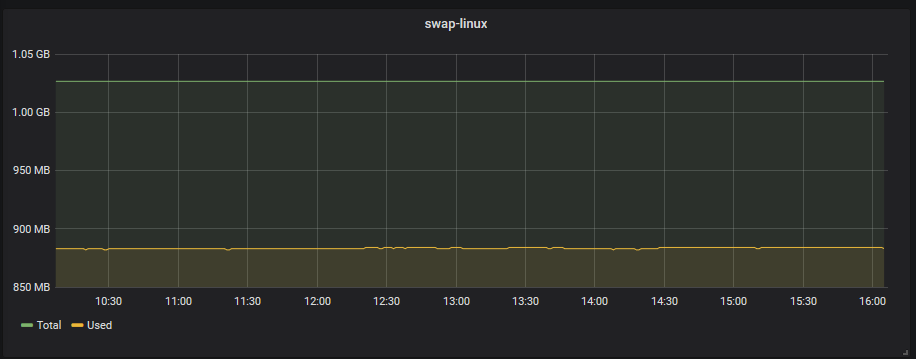
I configured a total value and the used value, so you see at one glance how much is used and free left. And the units are also correct. (GB).
Would it be possible to configure the plugin like: there is a dashboard in grafana “linux server”, there is panel id which 3 which shows the memory. point that panel to the memory check of that linux server in icinga. Do you know what I mean?
Don’t think so. It would mean that you would need to configure embedding graphs from different dashboards and that functionality is not there. But I know for sure that Carsten would welcome a code contribution.
But has your initial question been answered? If so mark it as resolved. We seem to have drifted off-topic here.
Cheers,
George
But I know for sure that Carsten would welcome a code contribution.
Sorry? Do you think I should open an issue on his github page?
But has your initial question been answered? If so mark it as resolved. We seem to have drifted off-topic here.
You are right. That has been my fault. But I’m not the creator of the thread.
I apologize for the snarky comment.
All I meant to say was that if you could in any way help the plugin be better, you should contribute.
And sorry for the misunderstanding, thought you were the original owner.
/George
1 Like