Hi there,
Unsure whether this is a bug, or a time issue, but a large number of checks (appear to be on the same satellites) are setting the last_check value to the wrong timestamp - at least I think that is is what is happening:
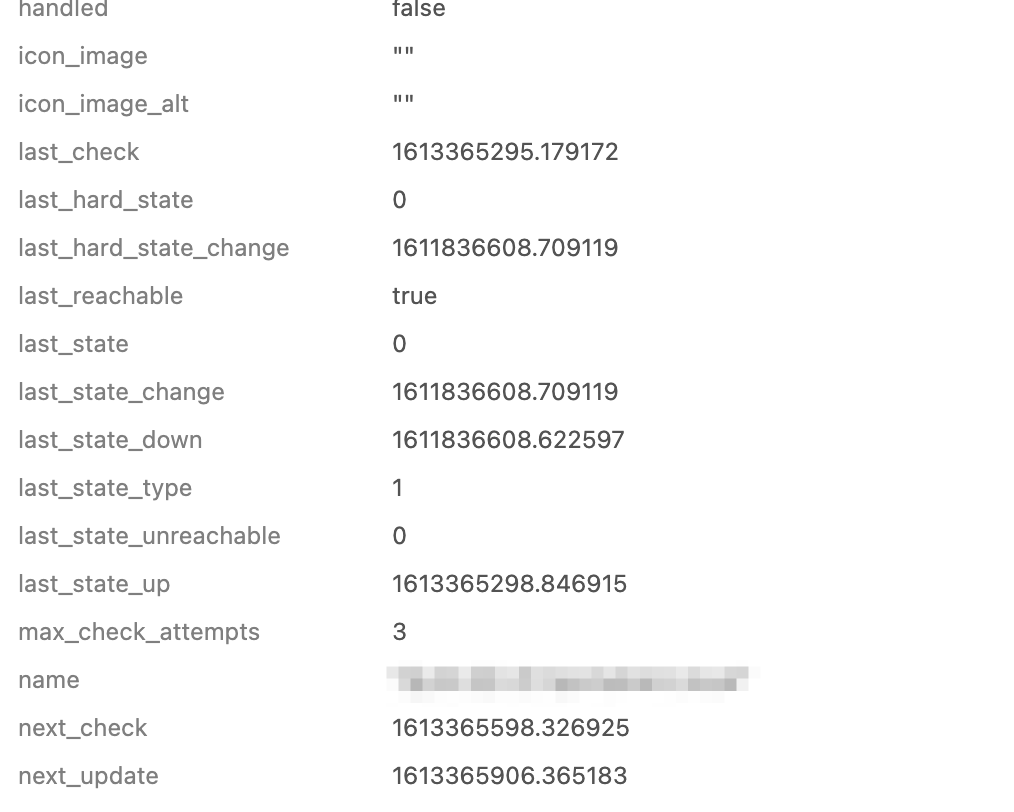
While reviewing a Service check executed locally on the host (disk-windows):
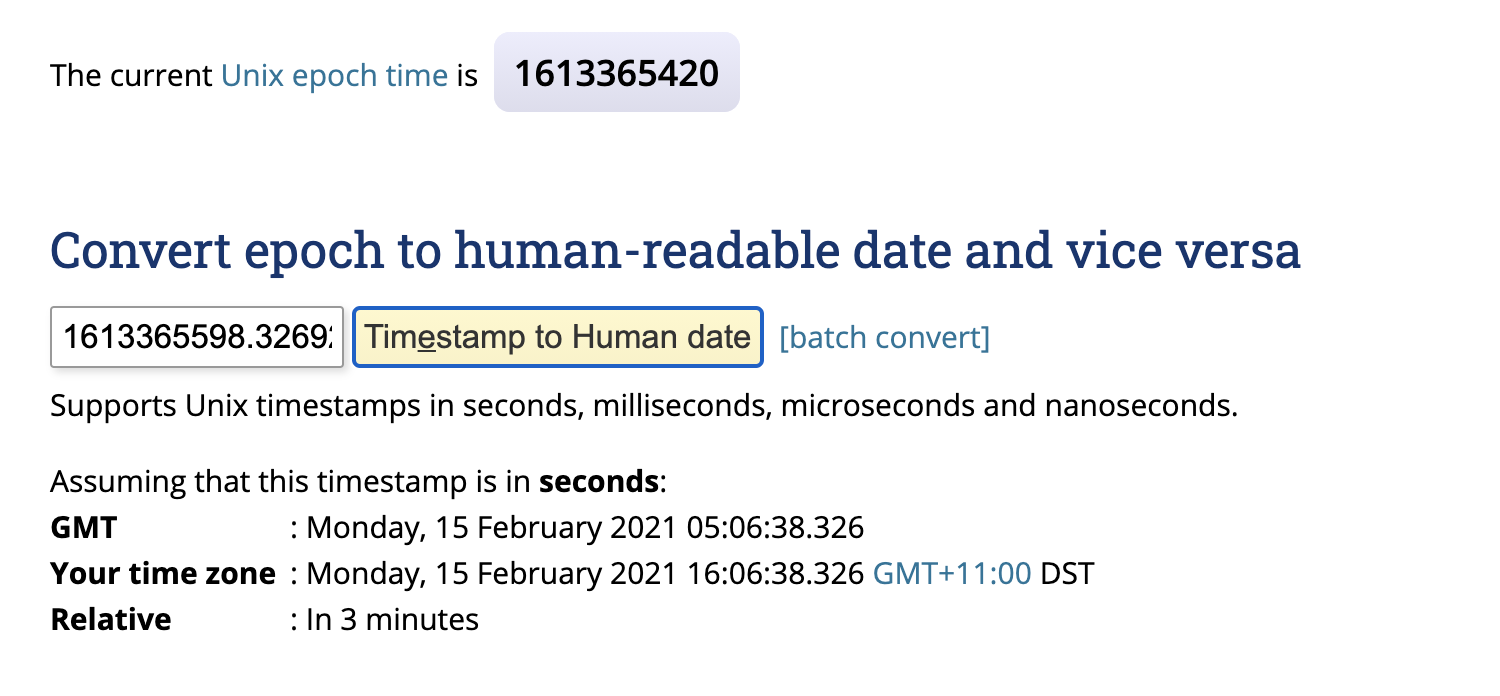
| last_check | 1607536417.295000 (Thursday, 10 December 2020 04:53:37.295 GMT+11:00 DST - 9 hours ago) |
|---|---|
| next_check | 1607566917 (Thursday, 10 December 2020 13:21:57 GMT+11:00 DST - 3 minutes ago) |
| next_update | 1607567217 (Thursday, 10 December 2020 13:26:57 GMT+11:00 DST - In 2 minutes) |
I reviewed it again a few minutes later:
| last_check | 1607537017.328000 (Thursday, 10 December 2020 05:03:37.328 GMT+11:00 DST - 9 hours ago) |
|---|---|
| next_check | 1607567925 (Thursday, 10 December 2020 13:38:45 GMT+11:00 DST - 2 minutes ago) |
| next_update | 1607568224.992000 (Thursday, 10 December 2020 13:43:44.992 GMT+11:00 DST - In 3 minutes) |
The last check value has incremented by 600 seconds (despite my check interval being 300) - so the check is being executed, but the wrong timestamp is being set somewhere.
I can’t see any reason why this is occurring - Both the masters, my 3 SQL servers, the satellite and agent are synced with NTP and have the same timezone and time set.
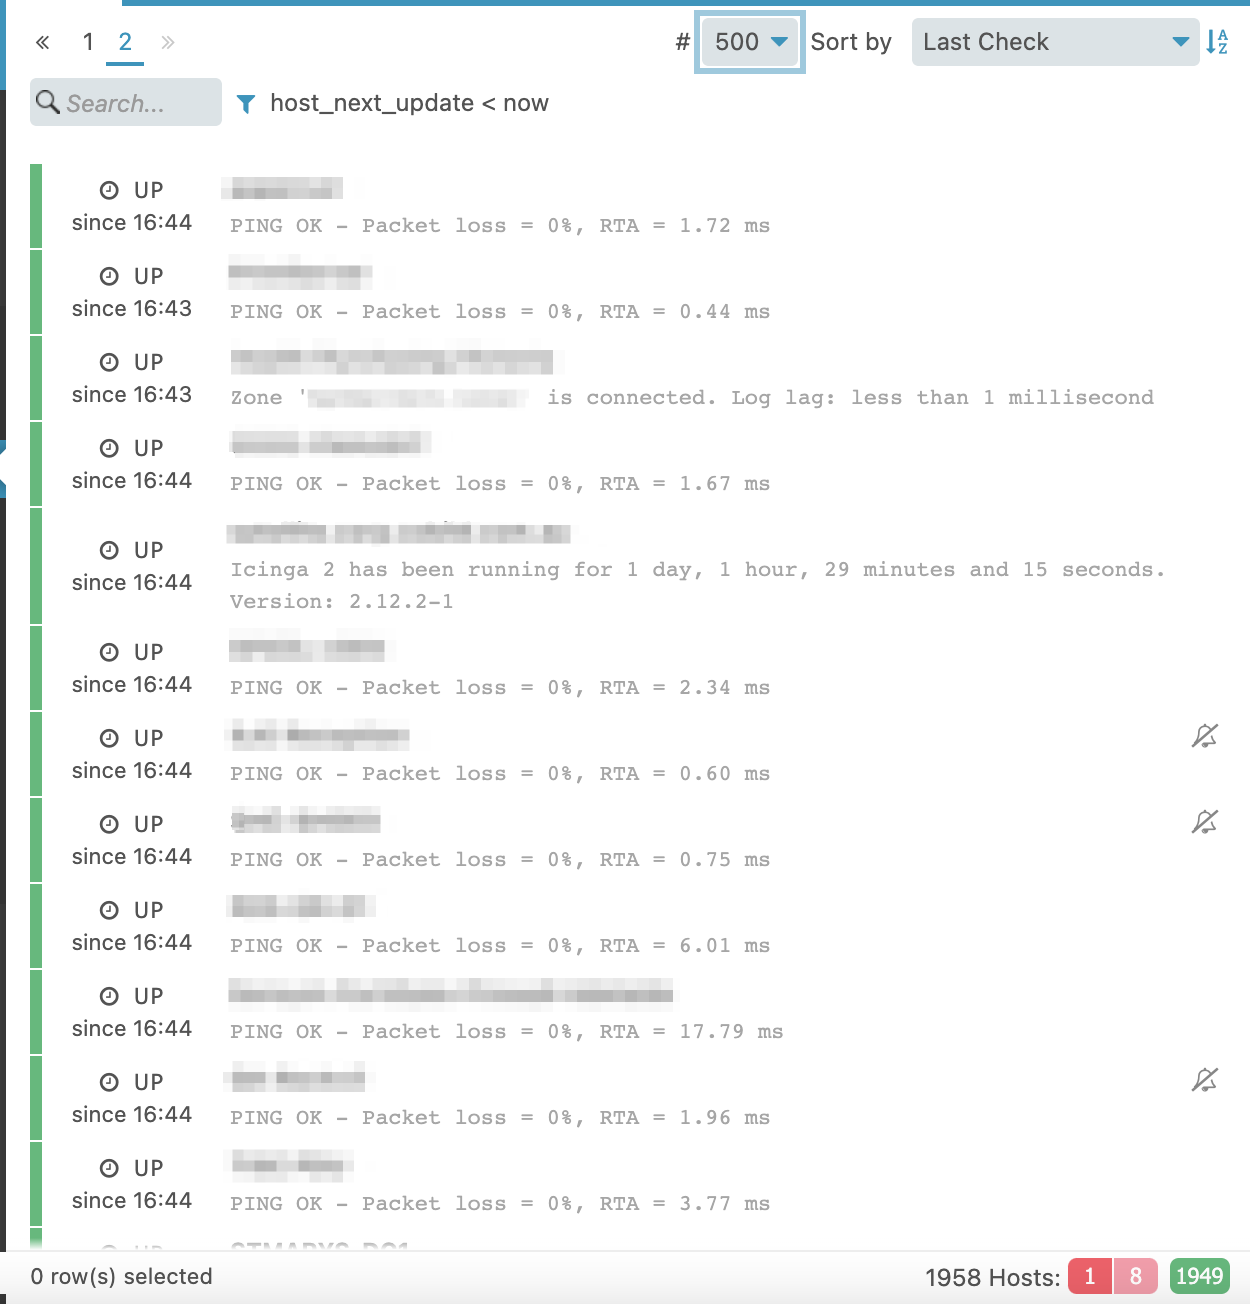
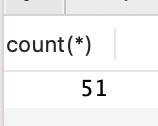
I am seeing some strange behaviour when I look at the Icingaweb2 overdue page too - hosts are coming and going - some moments there are 50+ hosts, I refresh a few moments later and it is down to 4 or 5.
Service checks appear to also behave in the same way.
This isn’t affecting all of my zones/satellites, majority are fine - hence why I am thinking it is a satellite issue, but I can’t see what would cause this to happen.
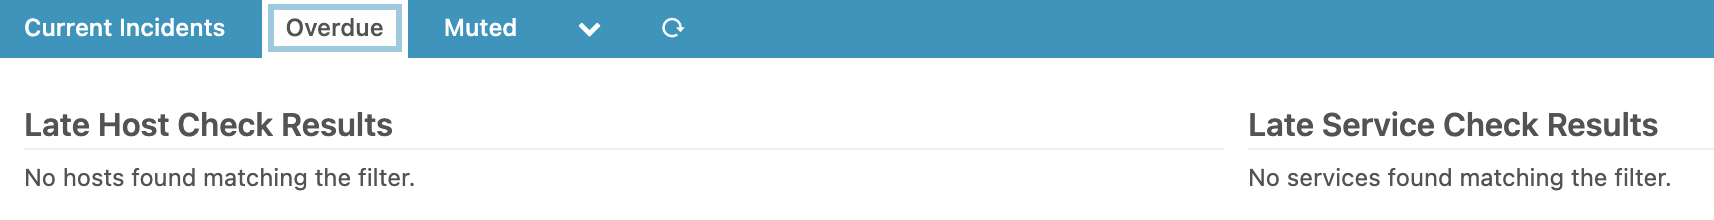
Another example:
Late Host Check Results
No hosts found matching the filter.
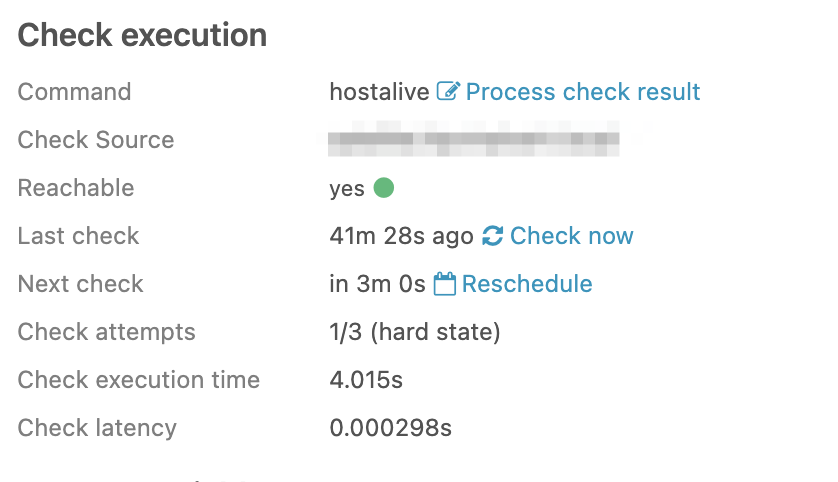
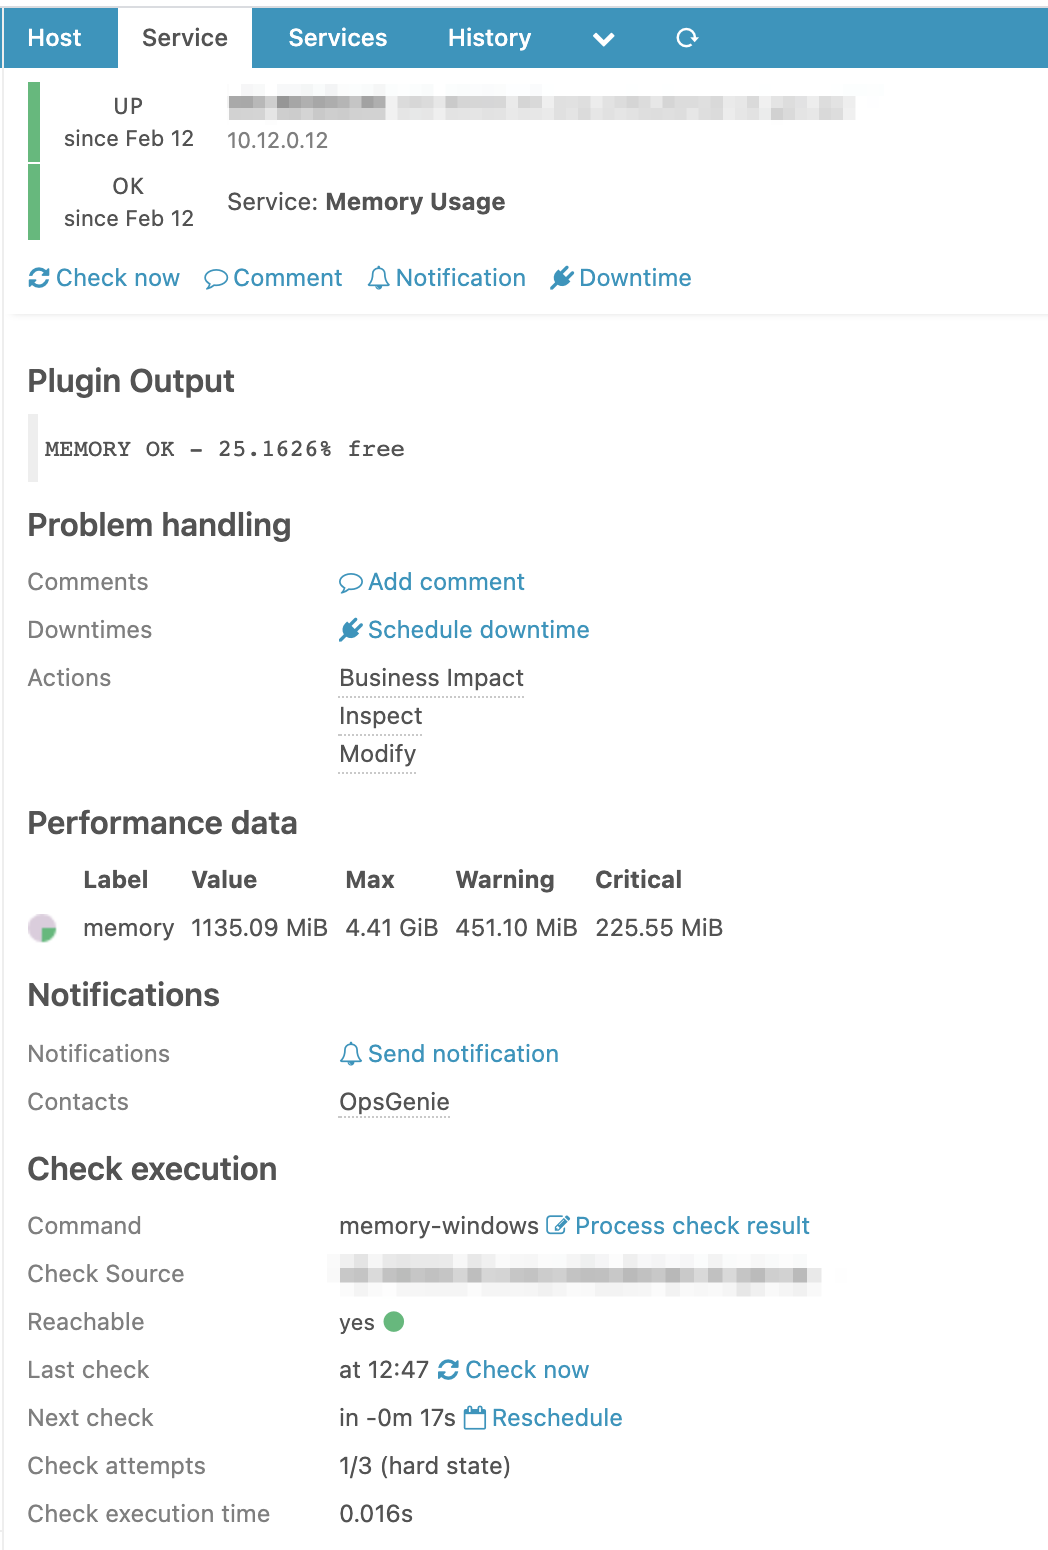
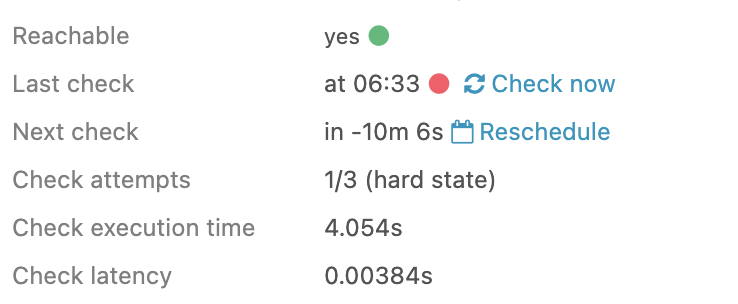
A host check (using hostalive) not appearing in overdue despite being overdue:
| last_check | 1607541656.825736 (Thursday, 10 December 2020 06:20:56.825 GMT+11:00 DST - 8 hours ago) |
|---|---|
| next_check | 1607570946.677169 (Thursday, 10 December 2020 14:29:06.677 GMT+11:00 DST - 2 minutes ago) |
| next_update | 1607571254.768501 (Thursday, 10 December 2020 14:34:14.768 GMT+11:00 DST - In 2 minutes) |
Another example:
I click check now on an overdue check, and see the check is executed:
[2020-12-10 15:26:13 +1100] notice/Process: Running command '/usr/lib64/nagios/plugins/check_nwc_health' '--community' '####' '--hostname' '10.35.0.17' '--mode' 'interface-usage' '--multiline': PID 48969
[2020-12-10 15:26:15 +1100] notice/Process: PID 48969 ('/usr/lib64/nagios/plugins/check_nwc_health' '--community' '####' '--hostname' '10.35.0.17' '--mode' 'interface-usage' '--multiline') terminated with exit code 0
Sorry this is a bit of a mess to read - our masters and satellites are on 2.12.2 - some agents on 2.11.3 but majority on 2.12.2.