Depends, it would impact only the checks pinned in the master zone, and it’s usually not the masters job to poll data.
MaxConcurrentChecks applies only to the checker feature (scheduler), so raising it on busy satellites can help, raising it on master shouldn’t change anything given you dont have much checks on your master zone.
You are right, MaxConcurrentChecks setting applies on the local icinga instance, it is not distributed with others configurations since it’s modified in the constants.conf file. Also, satellites dont get their checks scheduled by masters, they only get config from them and then schedule and load balance checks by themselves in their own zone.
Scheduler is supposed to spread checks over time to avoid load burst, even if thoses are on the same check interval as long as your total of checks for a zone is more than MaxConcurrentChecks it’s ok.
You have the precise inner workings of the scheduler here if it can help https://icinga.com/docs/icinga-2/latest/doc/19-technical-concepts/#check-scheduler
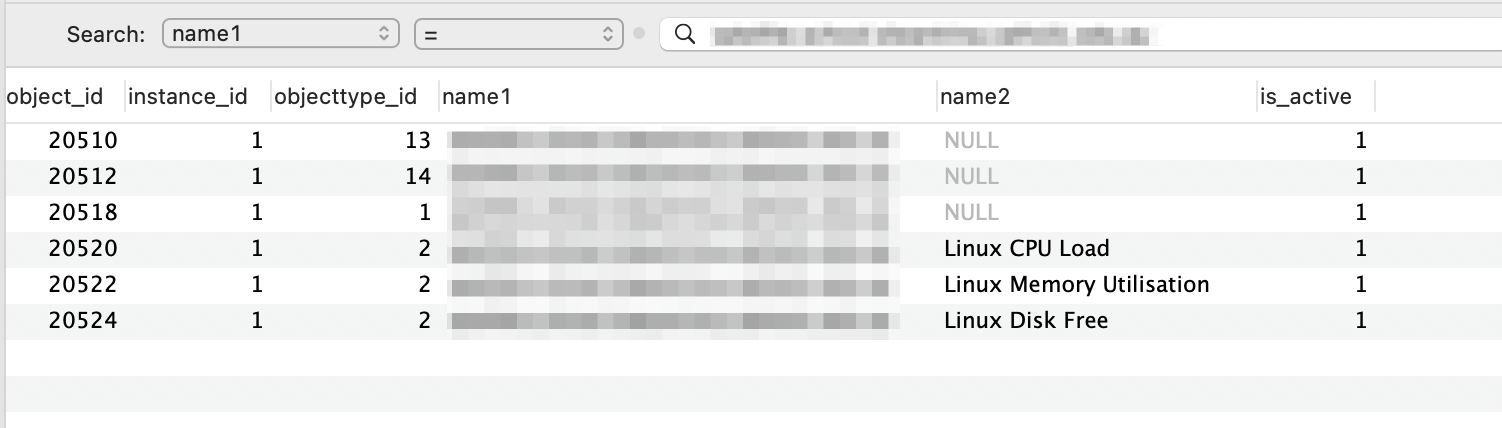
Having them with the is_active flag enabled makes me think that IDO is not updated properly, it can be for various reasons, but on the configuration side it seems fine, so as you have guessed in your last post it may be directly SQL related.
Given your feedback, i think you have not only one, but multiple issues, what i can advise for you to find root causes is to go on a simplier icinga architecture for a time (only one ido backend with one icingaweb frontend instance, alternate from one master to another and raise MaxConcurrentChecks on satellites with many checks), switching on/off parts and let it run as it for a time can help you to see what component is breaking the whole.
If you are going to do that i’d advise you to purge your ido database to help you reanalyze from scratch.
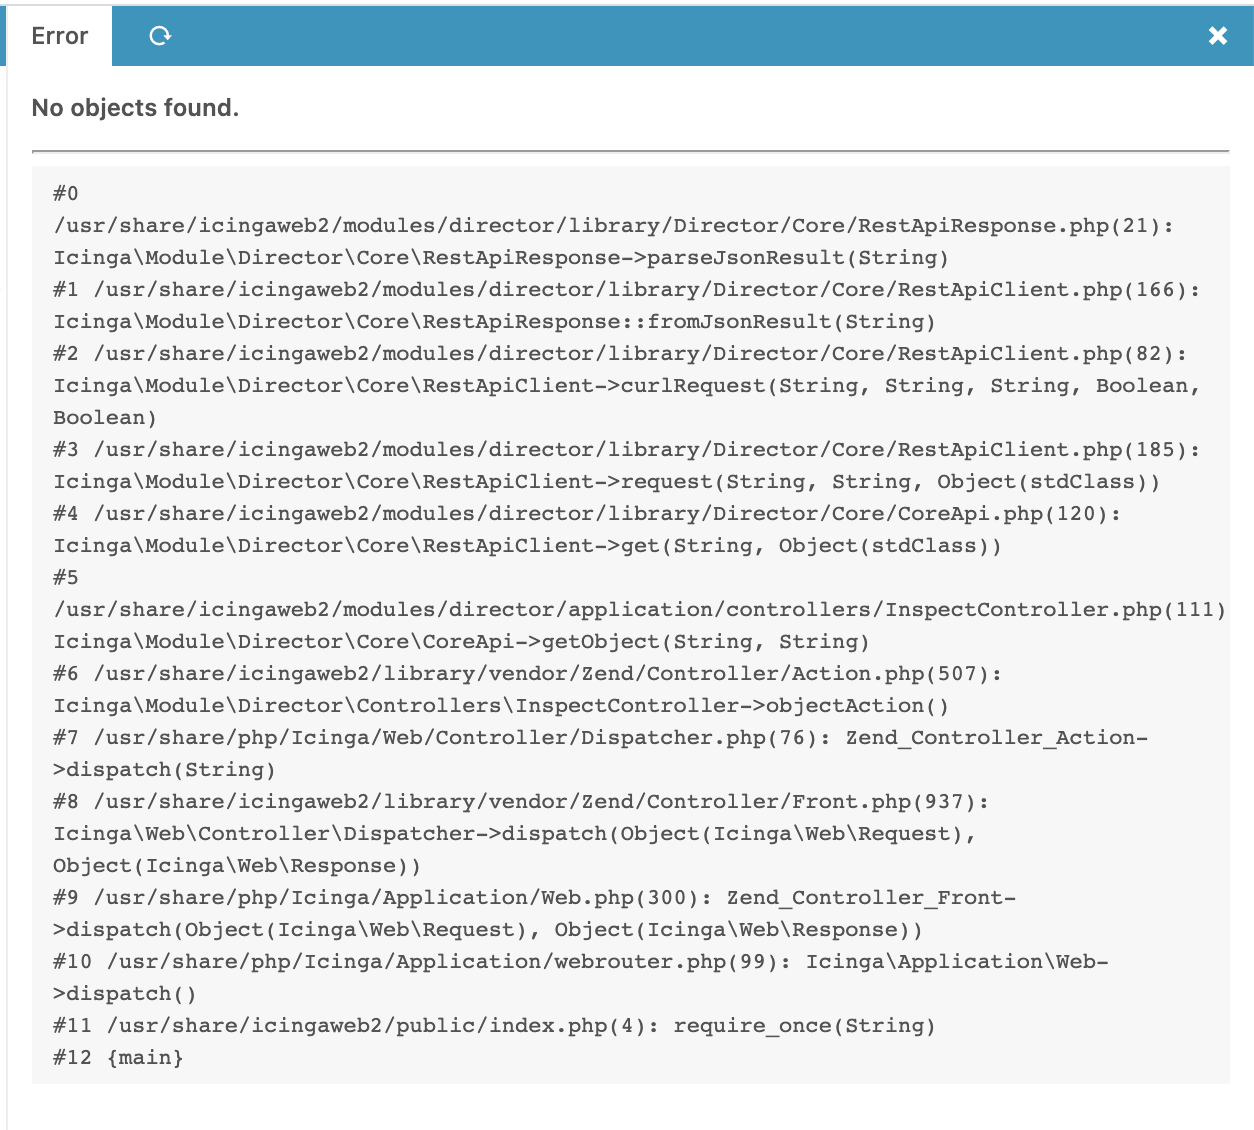
Last thing, for the checks that are overdue and causes you problems, you can have their check_source in icingaweb, if that’s always from the same poller/zone then you may have an issue on this endpoint precisely.
Strangely enough, when I was troubleshooting earlier, if I had one master running, everything was fine - it was as soon as the other became active where everything starts to fall apart.
We have had an IDO issue once before, where the NTP on our Hyper-V host went crazy and set the time briefly a few 100 days into the future, so a lot of host and service checks got their host_next_update set way into future, and never ran until we purged the IDO.
I’ll make a plan to turn off notifications, purge both API folders, purge the IDO and bring them back up.
I do agree it sounds like multiple issues, but we’ve been running with this architecture for over a year, and the issues only started happening after upgrading to 2.12.2.
Is there an easier way to purge the IDO other than dropping the tables and reimporting the schema?
Regarding the check_source, the current problematic checks are service checks that the masters executed on themselves.
It always seems to be the same checks on the same hosts which become overdue.
I can give it a try to dive in the code (i’m not an icinga dev, i may miss things) and see if there are differences that could have impacted you, you got this problem when you upgraded your masters to 2.12.2, but from which version ? i need a starting point to review diffs.
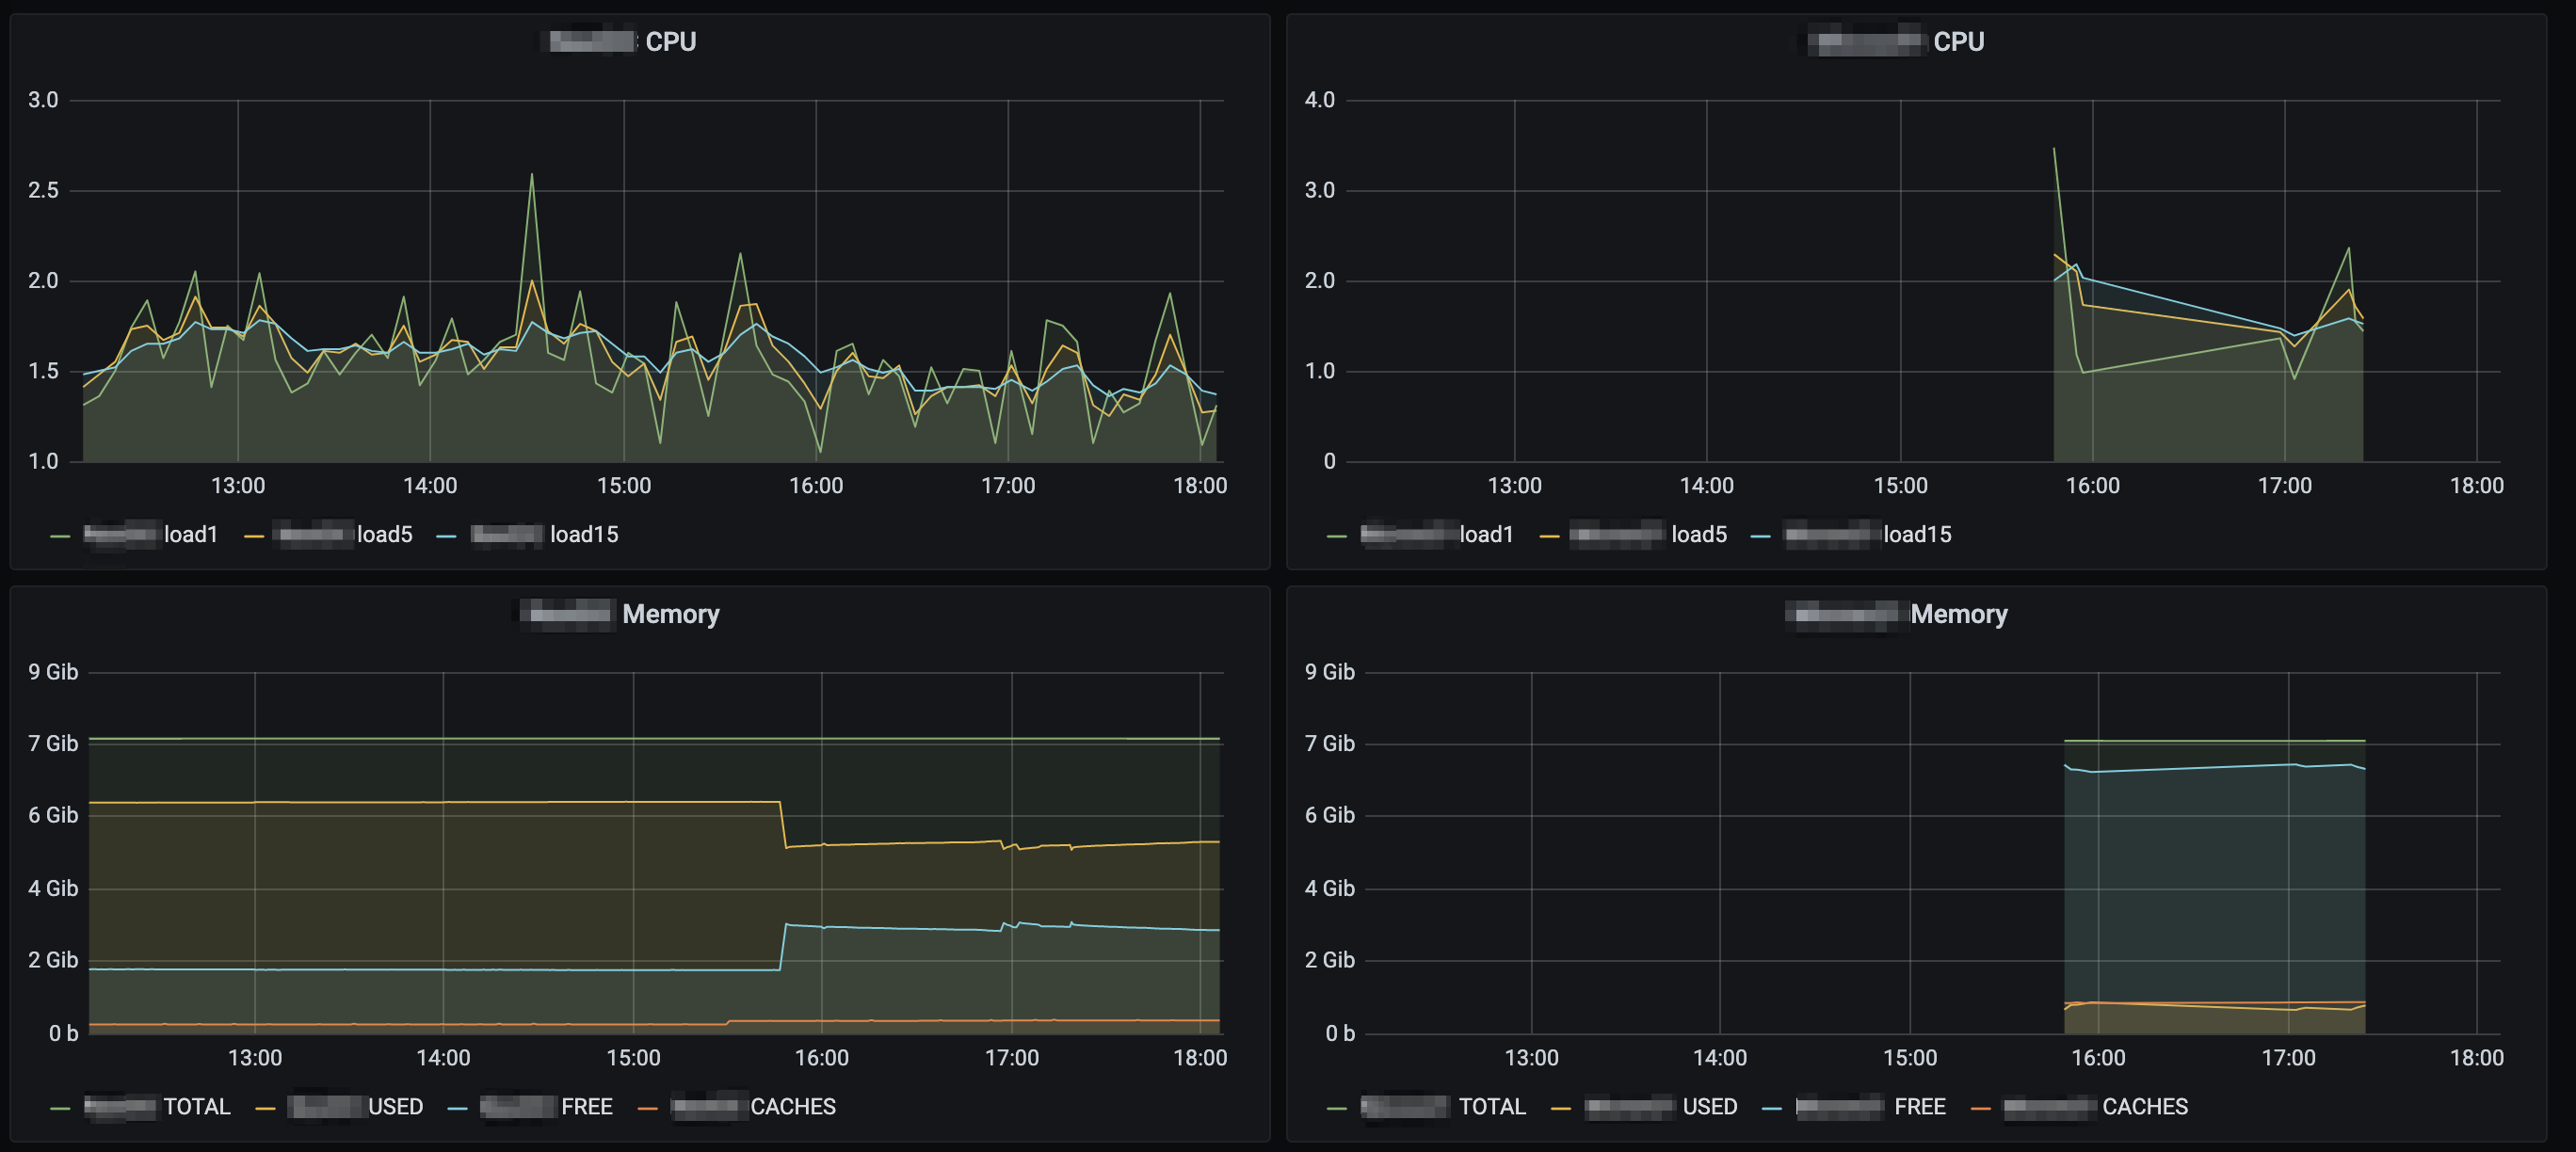
Well, I finally managed to get around to building a new blank database, and pointing both instances of Icinga to it.
Unfortunately, the issue still remains - as soon as the secondary master starts, all checks slowly become overdue, and as soon as I stop the secondary master - everything returns to normal within a few minutes - exactly the same behaviour as I witnessed previously.
I cannot understand how this is happening - I’m still not convinced this is a bug, because I haven’t seen anyone report anything similar with identical configurations, however this is such a breaking issue that without developer input, we’re pretty lost.
I hate to say it, as I’ve had nothing but great experiences up until this point, but we will have to evaluate whether Icinga is stable enough for us to continue using it.
Sorry for jumping in, but it seems to me it’s a configuration mistake. Have read several times in the thread that the hosts become normal again after you have stopped the second master i.e. it only happens when both masters are started. Does the second master even know that the other hosts exist? You can use API query to poll for some overdue hosts in both master endpoints, then see if you get the same output. It may be because you have configured the zone and endpoint definition of the satellites only in the first master. It would then explain why this happens. For all your hosts that directly connect to master1, the second master also has to be known by the hosts as being there and the hosts by the master2, so that in case of any failure of the first master or due to the object authority mechanism, the second master can take over. After all, that is what a cluster denotes.
Below I have an example of two masters and one satellite, how the configuration should look like.
And you can also configure the second master to accept configurations from the primary master to keep both in sync. And the second master must have exactly the same features enabled as in master1.
Sorry for the thread resurrection, but I thought I might post an update to this.
We’re still running a single instance, with the second master disabled.
We had all sorts of issues randomly pop up after months of working as expected, and I think I’ve finally worked out the culprit - the OpenTSDBWriter plugin.
We use both OpenTSDB and InfluxDB - with OpenTSDB enabled, thousands of hosts and services become overdue.
I am going to leave it disabled for a few days and see if the same issues pop up, but this is likely what has caused ALL of my issues since I created this thread.
Alright, we’ve left it disabled for the past 22 days, and everything has worked perfectly. No weird delays, no overdue checks, or overdue alerts.
My team took a look at the OpenTSDB writer plugin, and it looks like the problem is caused by the fact that each write is performed synchronously, and blocks all other functions from running.
This means that the problem is compounded as we scale - more hosts/checks = more writes, which means more time waiting for OpenTSDB.