picoroma
November 15, 2023, 3:29pm
1
Hi!
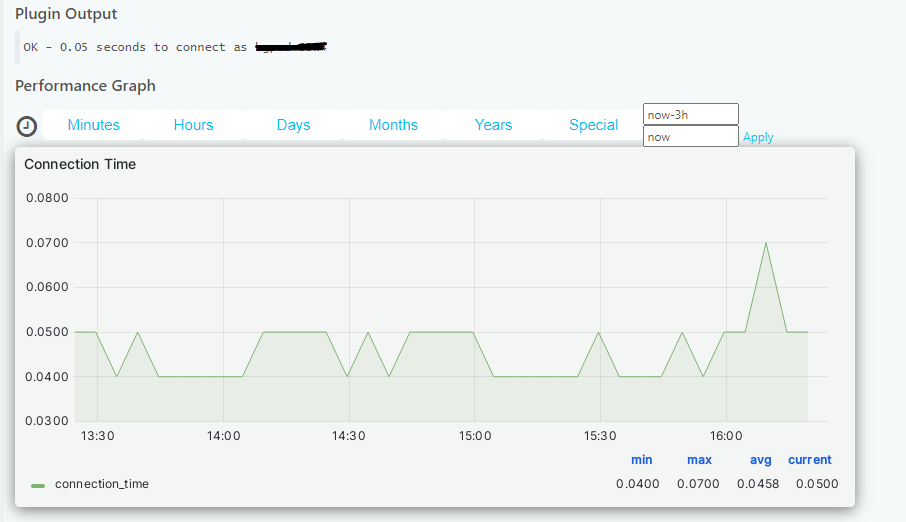
Before moving to ICINGADB I was able to see GRAFANA performance graph into the service details:
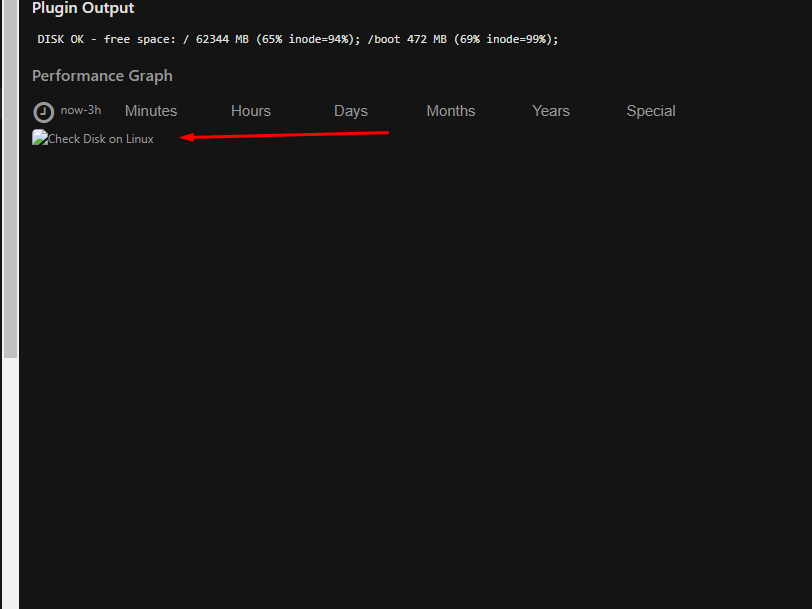
NOW If I try to view the service details from “Overview” - There is no graph at all
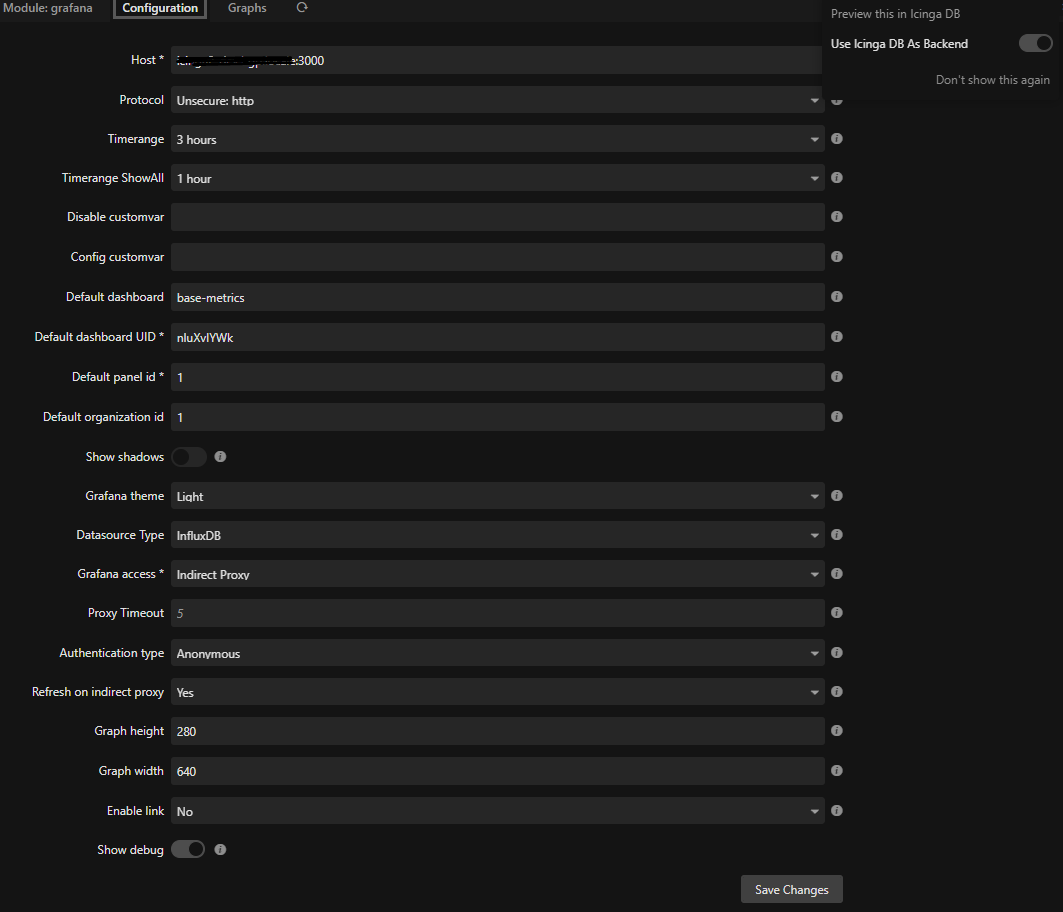
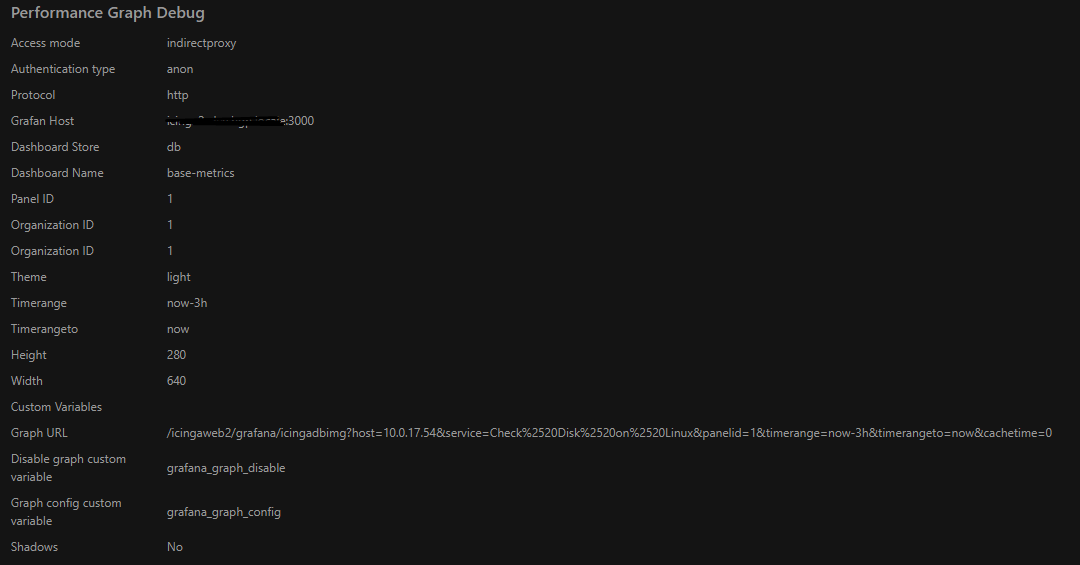
My GRAFANA CONFIGURATION IS:
Debut (enabled) do not show so much:
Do I have to perform some post migration activities (after move to ICINGADB) ?
rivad
November 15, 2023, 4:07pm
2
If I’m correct the Grafana module can only work with the monitoring module or the IcingaDB module, there isn’t a version that works with both. So if you update the module it will stop working in the classical monitoring module that is IDO based.
picoroma
November 15, 2023, 4:20pm
3
Yes,
But in my case it do not work at all.
Not in the OLD UI nor in the New one.
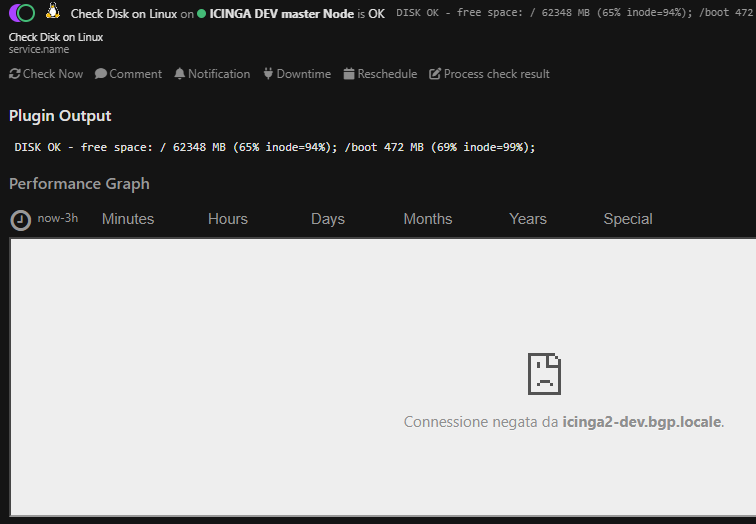
NOw I have this error (From Service Check View in IcingaDB menu):
I have a “connection refused” but my GRAFANA installation is on the same host of ICINGA…
rivad
November 15, 2023, 4:27pm
4
picoroma
November 15, 2023, 4:50pm
5
I 'm using iFrame…
restarted grafana
lorenz
November 15, 2023, 9:47pm
6
hm, works for me with version 2.0.3 of the grafana module
picoroma
November 16, 2023, 10:47am
7
I have the version 2.0.0b
Updated to 2.0.3 - NO CHANGE.
picoroma
November 16, 2023, 11:13am
8
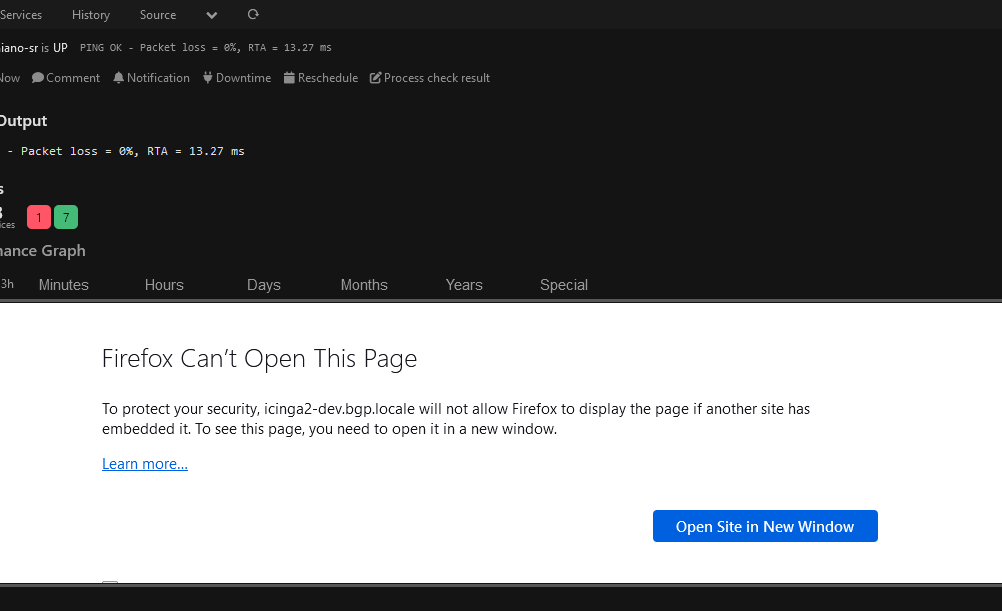
using FIREFOX I have ad additional INFO.
My ICINGA (icingaweb2) site is HTTP and even the GRAFANA SITE (that is on the same host) is HTTP.
Looking into CHROME Dev Tool I found:
Refused to display ‘http://icinga2.locale:3000/ ’ in a frame because it set ‘X-Frame-Options’ to ‘deny’.
How can I “ALLOW” X-Frame-Options ?