Hi,
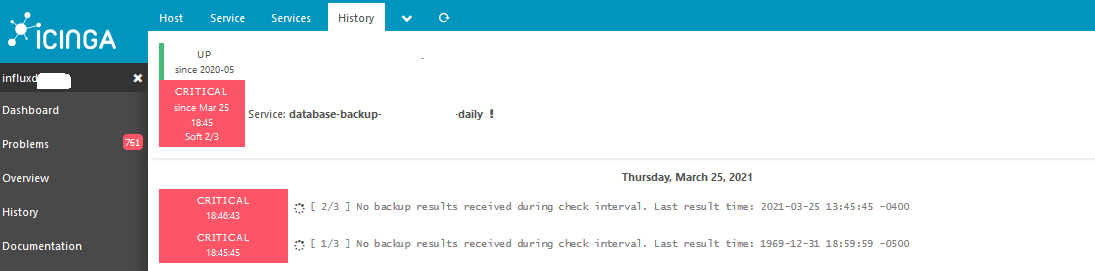
I have an HA master zone (master-1, master-2) where I send all API requests for passive checks results. I have an issue with some passive checks alarming (no result received …) but logs from host running the service (Node1 -passive service 1 @ Zone 1) show a 200 OK response from the “master”, log files on one of the “master” nodes show connections from the (Curl) user agent on its logs but Icinga Web show the alert indicating the result has not been received:
Node-1 - servies Passive 1 @ zone 1: bash script:
RESPONSE=$(curl -k -s
-u $ICINGAUSERNAME:$ICINGAPASSWORD
-H ‘Accept: application/json’
-X POST “$url”
–data-binary “${post_data}” 2>&1)
if [[ $(echo $RESPONSE | grep 200) ]] ; then
log_message “INFO - icinga2api - ${RESPONSE}”
APISUCCESS=0
else
log_message “WARN - icinga2api - Failed witth ${RESPONSE}”
Node-1 - servies Passive 1 @ zone 1: script logs:
[2021-03-25 15:00:01-04:00]: INFO - db1 - - sending check result(0) to https://monitoring-icinga.local:5665/v1/actions/process-check-result - INFO - Node is active, Skipping Backup
[2021-03-25 15:00:02-04:00]: INFO - icinga2api - {“results”:[{“code”:200.0,“status”:“Successfully processed check result for object ‘influxdb-1.internal!database-backup-db1-daily’.”}]}
[2021-03-25 15:00:02-04:00]: INFO - db1 - - backup completed with success
Icinga master node logs:
[2021-03-25 15:00:02 -0400] information/ApiListener: New client connection from [w.x.y.z]:57662 (no client certificate)
[2021-03-25 15:00:02 -0400] information/HttpServerConnection: Request: POST /v1/actions/process-check-result (from [w.x.y.z]:57662), user: externalchecker, agent: curl/7.29.0).
[2021-03-25 15:00:02 -0400] information/HttpServerConnection: HTTP client disconnected (from [w.x.y.z]:57662)
i Have checked icinga api documentation, api related posts (example1, example2, example3) but neither describes the issue on why I get a 200 from Icinga API but not the check result processed.
API setup details
I have one load balancer (monitoring-icinga.local) with two master nodes behind it (monitoring-icinga.local, icinga-1.local).
Question
Is there a way to find out why the passive check result was set to failed (no check results) ?
Replication of issue is not always possible, next script iteration will most likely succeed, clearing the alert, but this is a false possitive that should not occur.
Incinga software details
- Version used (
icinga2 --version)
icinga2 - The Icinga 2 network monitoring daemon (version: 2.11.6-1)
Copyright (c) 2012-2021 Icinga GmbH (https://icinga.com/)
License GPLv2+: GNU GPL version 2 or later http://gnu.org/licenses/gpl2.html
This is free software: you are free to change and redistribute it.
There is NO WARRANTY, to the extent permitted by law.System information:
Platform: CentOS Linux
Platform version: 7 (Core)
Kernel: Linux
Kernel version: 3.10.0-1160.21.1.el7.x86_64
Architecture: x86_64Build information:
Compiler: GNU 4.8.5
Build host: runner-wytxxqbb-project-322-concurrent-0Application information:
General paths:
Config directory: /etc/icinga2
Data directory: /var/lib/icinga2
Log directory: /var/log/icinga2
Cache directory: /var/cache/icinga2
Spool directory: /var/spool/icinga2
Run directory: /run/icinga2Old paths (deprecated):
Installation root: /usr
Sysconf directory: /etc
Run directory (base): /run
Local state directory: /varInternal paths:
Package data directory: /usr/share/icinga2
State path: /var/lib/icinga2/icinga2.state
Modified attributes path: /var/lib/icinga2/modified-attributes.conf
Objects path: /var/cache/icinga2/icinga2.debug
Vars path: /var/cache/icinga2/icinga2.vars
PID path: /run/icinga2/icinga2.pid
- Operating System and version
CentOS Linux release 7.9.2009 (Core)
Linux 3.10.0-1160.21.1.el7.x86_64 #1 SMP Tue Mar 16 18:28:22 UTC 2021 x86_64 x86_64 x86_64 GNU/Linux
- Enabled features (
icinga2 feature list)
Disabled features: command compatlog debuglog elasticsearch gelf graphite livestatus opentsdb perfdata statusdata syslog
Enabled features: api checker ido-mysql influxdb mainlog notification
- Config validation (
icinga2 daemon -C)
[2021-03-26 05:49:01 -0400] information/cli: Icinga application loader (version: 2.11.6-1)
[2021-03-26 05:49:01 -0400] information/cli: Loading configuration file(s).
[2021-03-26 05:49:01 -0400] information/ConfigItem: Committing config item(s).
[2021-03-26 05:49:01 -0400] information/ApiListener: My API identity: icinga-1.corp-apps.com
[2021-03-26 05:49:11 -0400] information/WorkQueue: #4 (DaemonUtility::LoadConfigFiles) items: 8, rate: 12.1333/s (728/min 728/5min 728/15min); empty in 18712 days, 9 hours, 49 minutes and 11 seconds
[2021-03-26 05:49:11 -0400] information/WorkQueue: #5 (InfluxdbWriter, influxdb) items: 0, rate: 0/s (0/min 0/5min 0/15min);
[2021-03-26 05:49:11 -0400] information/WorkQueue: #7 (ApiListener, SyncQueue) items: 0, rate: 0/s (0/min 0/5min 0/15min);
[2021-03-26 05:49:11 -0400] information/WorkQueue: #6 (ApiListener, RelayQueue) items: 0, rate: 0/s (0/min 0/5min 0/15min);
…
[2021-03-26 05:50:41 -0400] warning/ApplyRule: Apply rule … OMITED
…
[2021-03-26 05:50:41 -0400] information/ConfigItem: Instantiated 1 InfluxdbWriter.
[2021-03-26 05:50:41 -0400] information/ConfigItem: Instantiated 118 ScheduledDowntimes.
[2021-03-26 05:50:41 -0400] information/ConfigItem: Instantiated 310 HostGroups.
[2021-03-26 05:50:41 -0400] information/ConfigItem: Instantiated 1 EventCommand.
[2021-03-26 05:50:41 -0400] information/ConfigItem: Instantiated 1 FileLogger.
[2021-03-26 05:50:41 -0400] information/ConfigItem: Instantiated 3 NotificationCommands.
[2021-03-26 05:50:41 -0400] information/ConfigItem: Instantiated 1 NotificationComponent.
[2021-03-26 05:50:41 -0400] information/ConfigItem: Instantiated 99371 Notifications.
[2021-03-26 05:50:41 -0400] information/ConfigItem: Instantiated 1 IcingaApplication.
[2021-03-26 05:50:41 -0400] information/ConfigItem: Instantiated 6655 Hosts.
[2021-03-26 05:50:41 -0400] information/ConfigItem: Instantiated 351 Downtimes.
[2021-03-26 05:50:41 -0400] information/ConfigItem: Instantiated 1 ApiListener.
[2021-03-26 05:50:41 -0400] information/ConfigItem: Instantiated 127368 Dependencies.
[2021-03-26 05:50:41 -0400] information/ConfigItem: Instantiated 4683 Comments.
[2021-03-26 05:50:41 -0400] information/ConfigItem: Instantiated 1 CheckerComponent.
[2021-03-26 05:50:41 -0400] information/ConfigItem: Instantiated 66 Zones.
[2021-03-26 05:50:41 -0400] information/ConfigItem: Instantiated 80 Endpoints.
[2021-03-26 05:50:41 -0400] information/ConfigItem: Instantiated 21 ApiUsers.
[2021-03-26 05:50:41 -0400] information/ConfigItem: Instantiated 1 IdoMysqlConnection.
[2021-03-26 05:50:41 -0400] information/ConfigItem: Instantiated 425 CheckCommands.
[2021-03-26 05:50:41 -0400] information/ConfigItem: Instantiated 6 TimePeriods.
[2021-03-26 05:50:41 -0400] information/ConfigItem: Instantiated 2 Users.
[2021-03-26 05:50:41 -0400] information/ConfigItem: Instantiated 94842 Services.
[2021-03-26 05:50:41 -0400] information/ConfigItem: Instantiated 51 ServiceGroups.
[2021-03-26 05:50:41 -0400] information/ScriptGlobal: Dumping variables to file ‘/var/cache/icinga2/icinga2.vars’
[2021-03-26 05:50:41 -0400] information/cli: Finished validating the configuration file(s).
- If you run multiple Icinga 2 instances, the
zones.conffile (oricinga2 object list --type Endpointandicinga2 object list --type Zone) from all affected nodes
config file is too long to obfuscate without making readability errors; if needed will > require the time to obfuscate. Sample lines:
object Endpoint “icinga-1.local” {
host = “monitoring-icinga-master-1.domain7.internal”
port = 5665
}
object Endpoint “monitoring-icinga.local” {
host = “monitoring-icinga-1.domain7.local”
port = 5665
}
object Zone “master” {
endpoints = [ “monitoring-icinga.local”, “icinga-1.local”, ]
}object Zone “domain11” {
endpoints = [ “satellite-1.domain11.internal”, “satellite-2.domain11.internal”, ]
parent = ZoneName
}object Zone “domain9” {
endpoints = [ “satellite-1.domain9.internal”, ]
parent = ZoneName
}
object Zone “global” {
global = true
}object Zone “global-external” {
global = true
}object Zone “global-internal” {
global = true
}
…
object Endpoint “satellite-public-1.domain5.internal” {
host = “satellite-public-1.domain5.internal”
port = 5665
log_duration = 0
}object Endpoint “satellite-public-1.domain4.internal” {
host = “satellite-public-1.domain4.internal”
port = 5665
log_duration = 0
}object Endpoint “satellite-public-2.domain6.internal” {
host = “satellite-public-2.domain6.internal”
port = 5665
log_duration = 0
}
object Endpoint “satellite-4.domain6.internal” {
host = “satellite-4.domain6.internal”
port = 5665
log_duration = 0
}object Endpoint “satellite-4.domain7.internal” {
host = “satellite-4.domain7.internal”
port = 5665
log_duration = 0
}object Endpoint “satellite-4.domain13.internal” {
host = “satellite-4.domain13.internal”
port = 5665
log_duration = 0
}