Hi,
I have a graphite module running on the server with icinga2 and another server hosting graphite web.
But I am unable to fetch the metrics.
This is the debug log
+ Icinga check command: 'http'
+ Obscured check command: NULL
+ Applying templates for check command 'http'
++ Not applying template 'response-size'
++ Not applying template 'response-time'
+ Applying default templates, excluding previously used metrics
++ Applying template 'default-host'
+++ Fetched 0 metric(s) from 'http://graphite/metrics/expand?query=icinga2.somename.com.host.http.perfdata.%2A.value'
+++ Excluded 0 metric(s)
+++ Combined 0 metric(s) to 0 chart(s)
++ Not applying template 'default-service'
How are the connection settings for the graphite module looking?
Are you sure graphite web is published on port 80?
Can you access Graphite Web via the browser?
Thanks for the quick response.
The backend for graphite module is connecting to FQDN of the graphite web and yes the it is accessible via browser.
Also adding “/render” to the url provides with an image displaying “No Data”.
The graphite web needs to use the database of icinga2 right? If so, where do I configure this.
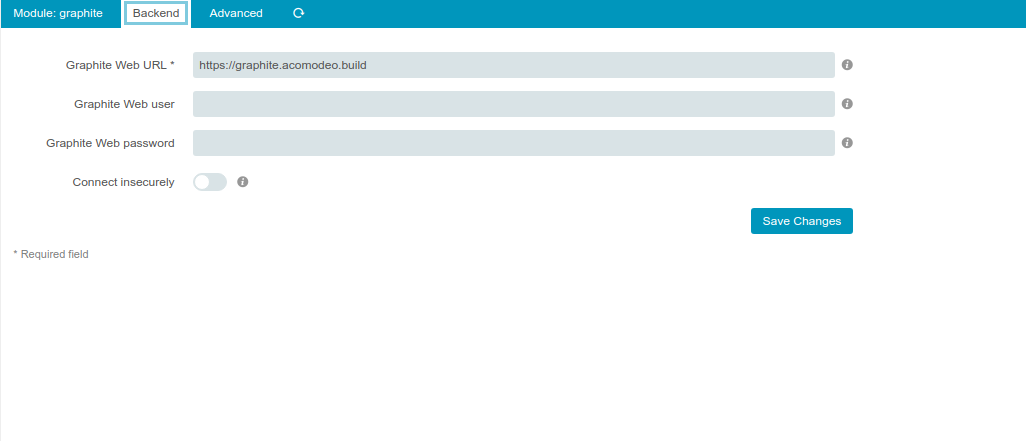
When you access graphite from a browser, does it look like all the icinga metrics are populating there? If not, I’d suggest docker exec -it [containername] /bin/sh and make sure you’re seeing whisper files generating. If not, can we see the content of /etc/icinga2/features-enabled/graphite.conf? Also, can you take a screenshot of the Icingaweb2 modules > graphite > backend page?
Here are the contents of /etc/icinga2/features-enabled/graphite.conf
/**
 * The GraphiteWriter type writes check result metrics and
 * performance data to a graphite tcp socket.
 */

library "perfdata"

object GraphiteWriter "graphite" {
  host = "graphite.acomodeo.build"
  port = 2003
  enable_send_thresholds = true
  enable_send_metadata = true
}
and here is the screenshot of Icingaweb2 modules > graphite > backend page
For the URL in Icingaweb, you probably want http://graphite.acomodeo.build:8080/ and possibly /graphite/ after it depending on the config in that container, unless you’ve reverse proxied it with https.
That doesn’t explain why it isn’t writing metrics though. Do you see any connection errors in the Icinga logs? How about the docker logs?
OpenTsdb is a totally different thing. If you’re not using it, you can run icinga2 feature disable opentsdb and that should go away.
Can you find the carbon.conf file inside that container and review some of the connection settings in it? I’m not sure how it ships its default config.
I have reviewed carbon.conf in the docker and made changes according to setup walkthrough mentioned by log1c, still the issue remains.
Also, I tried using http://graphite.acomodeo.build:8080/graphite/ URL in Icingaweb but it results in timeout as it fails to connect on port 8080.
The document mentioned is for setting up a clustered carbon from scratch, you don’t want to add relay settings to a container that previously only had one cache daemon, that’ll make things worse.
Can you revert carbon.conf and show us what’s in it that way? Additionally, your Icinga system has a check_tcp plugin you can use. Change into your nagios plugins dir and try this:
./check_tcp -H graphite.acomodeo.build -p 2003
Repeat for every port you need to be able to connect to and you should see if something is blocking them.
Do you have a firewall of some sort running on that server? I recall you mapping the ports in your Docker command, but something’s blocking them. Also that’s interesting that it has a single cache daemon and a relay. is the ENDPOINT/CMD of the Dockerfile loading just carbon-cache.py or also carbon-relay.py? If carbon-relay you’d want Icinga pointing at 2013, but I doubt its doing that.