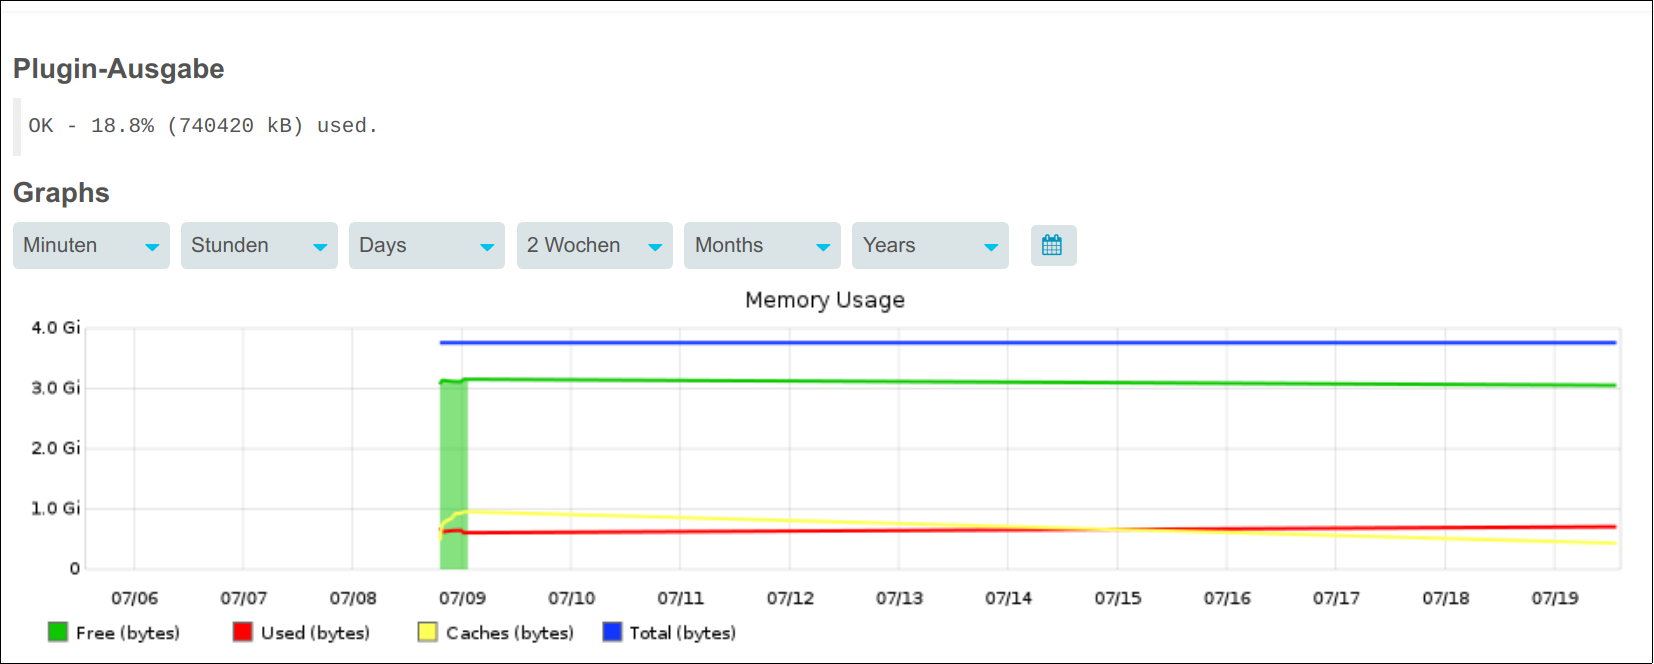
After I reboot my monitoring server seems to reset all graphs every time.
This is happening on two separate servers.
I even reinstalled the one of the servers following the installation instructions strictly.
Any idea what could be happening here?
Or how I can start debugging this issue in a good way?
As a starting point, it would be interesting to know if the whisper files are really no longer present.
Maybe you could look for the whisper files (e.g. at /opt/graphite/storage/whisper/icinga2/…) and check if older performance-data is present.
Look for the tool whisper-fetch.py, which accepts an “Unix Epoch Timestamp” for the argument
Thank you very much for this info.
whisper-fetch shows nicely that after a reboot values simply disappear.
But not for all days or all times. E.g. I just did a reboot and only these are left:
Mon Jun 14 13:00:00 2021 -0.000177
Mon Jun 14 13:30:00 2021 -0.000270
Mon Jun 14 14:00:00 2021 -0.000026
Mon Jun 21 09:30:00 2021 -0.000058
[…]
Tue Jun 22 01:00:00 2021 -0.000449
Before and after this time range, values are set to “None”.
I don’t think it has to do with the schemas definitions.
They are in my case:
Since I was surprised that there are only values every 30min I ran whisper-fetch without “–from” and then it showed a value for every minute. Is this a known side effect? The documentation doesn’t mention it:
OPTIONS
       --from Unix epoch time of the beginning of your requested interval (default: 24 hours ago).
I’d say this is to be expected. The timestamp 1618993772 dates to Apr 21st, which is inside the retention period of 90d defined in the schema definition. This retention aggregate the values of the previous retention period (5m:14d), so basically it make one “30m” value out of six “5m” values.
The post linked by homerjay explaines this in more detail
As to why the values/graphs are disappearing after a reboot, I have no idea atm. I never had that issue before.
I was already watching because I was curious if someone has a solution as I never experienced something like this.
Only idea I have would be a cache service getting killed before he can write the data as the webinterface can also ask the cache in addition to the files.
But if values from the file get deleted that already existed I have no idea.
(because there a two checks with a different check_interval)
Instead of using whisper-resize this time I deleted the entire whisper directory: rm -r /var/lib/graphite/whisper/icinga2 /var/lib/graphite/whisper/carbon
I waited for 1,5 days and did a reboot now.
Result: no data loss this time
Could my problem be related to whisper-resize? Doesn’t make sense either however.
Weird problem. I could imagine, that the whisper-resize wasn’t executed successfully after a change of the storage-schemas.conf in the past - that can happen pretty quickly.
Please let us know if this solved your problem (when you have continued to watch this).
Thanks.
The cache will keep metrics in memory as long as it can not write them to the disk. So yes, if the cache is the process causing the memory consumption it could be. And it could be that it gets killed instead of writing everything to disk during reboot.
There are some settings influencing, especially limiting, how much it is writing in a time frame. Especially MAX_UPDATES_PER_SECOND, MAX_UPDATES_PER_SECOND_ON_SHUTDOWN and MAX_CREATES_PER_MINUTE, but also logging if enables and tagging can influence write performance and by this caching.
If it is not reaching the limits, it could also be necessary to enable additional cache instances and add a relay in between so distribute the load.
Thanks for your suggestions. These are my current settings (still the default):
MAX_UPDATES_PER_SECOND = 500
not set: MAX_UPDATES_PER_SECOND_ON_SHUTDOWN
MAX_CREATES_PER_MINUTE = 50
Does that sound too low to you?
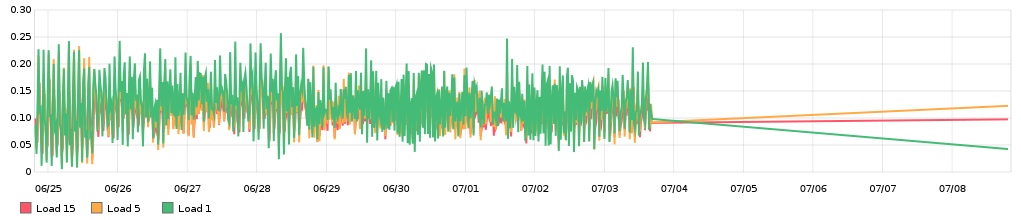
I’m only monitoring 12 hosts with 324 services on this node. (2 CPUs of a Intel Xeon, 4 GB RAM)
The avg load is 0.2.
I think MAX_CREATES_PER_MINUTE is much too low by default, but with this environment size and that it is not only an initial problem, it should not cause any problems.
MAX_UPDATES_PER_SECOND should also not limit such a small environment, even with 1 minute check interval and if every check would update 50 or more metrics.
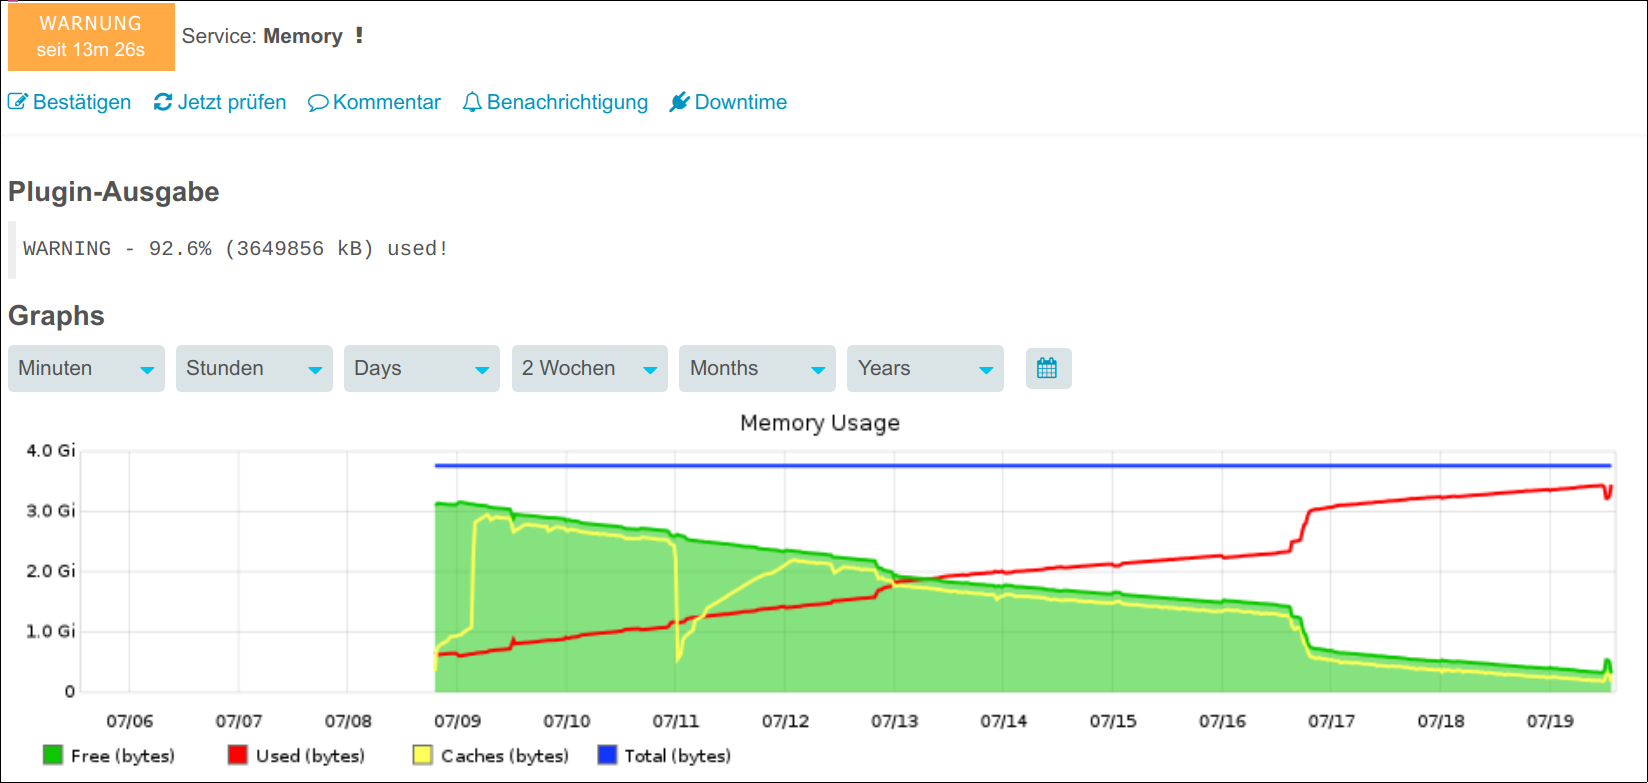
You lost 10 days of data when the service was killed, so a big amount of data had to be kept in memory. When the shown graph is from the graphite system this would explain the consumption, but not why this is all held in memory instead of written to the disk. Are there any other settings changed? Are there settings of the Linux system changed like the kernel parameter vm.dirty_ratio, vm.dirty_background_ratio, vm.swappiness or something else affecting memory handling? How is the setting of the graphite writer feature, so are metadata and thresholds enabled (but this should not increase the metrics to an unhandleable amount)? Can you enable LOG_UPDATES and LOG_CREATES so you can see if the cache is writing to the disk (if everything runs fine updates log can grow fast and big so this should not be enabled in production afterwards)?
I am really just guessing as I think killing the cache daemon while it has not written its data is the only reason this could happen, but I have no idea why it should behave in such an extreme way in such a small environment.
I kept watching it for a while and I believe now that it really must have to do with the carbon cache.
After I restart the service (service carbon-cache restart) the graphs are empty.
whisper_fetch shows that no new data is written to the wsp files anymore.
And the modify date of the wsp files is really old - although the graphs are showing new values.
Does that imply that the data is only kept in the cache? That would explain why it gets lost after a restart. But why doesn’t it get written to the files at all?
I still do not have a solution, but maybe you could analyze what happens when you restart the carbon-cache, e.g. with BPF tools (like execsnoop) or something else.
Yes, the question why is it not writing data is the important one.
Carbon-Cache has two jobs, one is cache the data so they can be read without the immediate need to right them to disk, the other is to order the data to optimize write and then write them to the disk.
We already checked the configuration values which would limit the writing which looked fine. So did you enable creates (LOG_CREATES) and updates (LOG_UPDATES) log? Perhaps this can give you a clue, but it could also be simply empty as nothing happens. Also a look at CACHE_WRITE_STRATEGY and perhaps deactivating cache at all with WHISPER_AUTOFLUSH could be worth a try.
01/10/2021 22:21:51 :: wrote 1 datapoints for icinga2.yyyy.services.procs.by_ssh.perfdata.procs.value in 0.00008 seconds
01/10/2021 22:21:51 :: wrote 1 datapoints for icinga2.xxxx.services.disk.by_ssh_disk.perfdata._.max in 0.00009 seconds
01/10/2021 22:21:51 :: wrote 1 datapoints for icinga2.xxxx.services.disk.by_ssh_disk.perfdata._.min in 0.00008 seconds
01/10/2021 22:21:51 :: wrote 1 datapoints for icinga2.xxxx.services.disk.by_ssh_disk.perfdata._.warn in 0.00007 seconds
01/10/2021 22:21:51 :: wrote 1 datapoints for icinga2.xxxx.services.disk.by_ssh_disk.perfdata._.crit in 0.00007 seconds
01/10/2021 22:21:51 :: wrote 1 datapoints for icinga2.xxxx.services.disk.by_ssh_disk.perfdata._.value in 0.00008 seconds
01/10/2021 22:21:51 :: wrote 1 datapoints for icinga2.zzzz.services.Process_ntpd.by_ssh.perfdata.procs.min in 0.00008 seconds
CACHE_WRITE_STRATEGY is set to “sorted”. Is that ok?
On Friday I deactivated the cache by setting WHISPER_AUTOFLUSH to true
but when I restarted the carbon cache this morning all values since Saturday noon were gone again:
Yes, this is the default and with a uniform resolution of the metrics it should produce the best result.
With the cache being effectively disabled by WHISPER_AUTOFLUSH, I would say Graphite is not the problem, but it should be a problem of the system’s filesystem cache or the filesystem itself.
The first one is simple to test by using sync which will execute the system call to write from memory to disk, but this should be done automatically during shutdown anyways.
From what I know ext4 is still Debian 10’s default filesystem which should be pretty stable. Not aware of any other filesystem with issues, but still to ensure: What filesystem do you use and any specific mount options (not only from /etc/fstab but also default mount options from tune2fs -l)?
Any other caching involved here like a hardware raid-controller?