Graphite resets graphs after each server reboot

Hi.

Here some unlikely reasons:

  1. Are you sure that the storage-schemas.conf is the one which is used by the carbon-chache service?

  2. Is it possible, that another (maybe old) carbon-cache service is running (already saw something similar accidentally happen)?


Greetings.

Thanks for your ideas!

I think so but now that you mention it - how can I be sure? fuser is not showing it as an open file and I don’t see any reference to it in other carbon-cache config files.

Don’t think so. I only see one carbon-cache in the process table:

USER       PID  PPID S CPU  NI %MEM   RSS    VSZ  START     ELAPSED   TIME CMD
_graphi+   770     1 S   -   0  0.5 54636 207420  12:57    01:09:08   0:19 /usr/bin/python3 /usr/bin/carbon-cache --config=/etc/carbon/carbon.conf --pidfile=/var/run/carbon-cache.pid --logdir=/var/log/carbon/ start

Hi again.

Since the file is only read at startup, you could trace the execution,
for example with strace, by:

# Please note: carbon-cache must not be running
strace -e trace=open,openat /opt/graphite/bin/carbon-cache.py start --pidfile=/opt/graphite/storage/carbon-cache.pid 2>&1 | grep "storage-schemas.conf"

The paths depend on your setup.
You can check the executables e.g. by:

# look for ExecStart=
systemctl cat carbon-cache.service

Greetings.

Good idea!

And yes, it’s being read:

openat(AT_FDCWD, "/etc/carbon/storage-schemas.conf", O_RDONLY|O_CLOEXEC) = 7

We are really running out of ideas here. sigh

Just out of curiosity, could you try this:

  • Take a look at the graphs, if they are ok
  • Stop carbon-cache
  • Are the graphs are still there?
  • Start the carbon-cache
  • Are the graphs are still there?

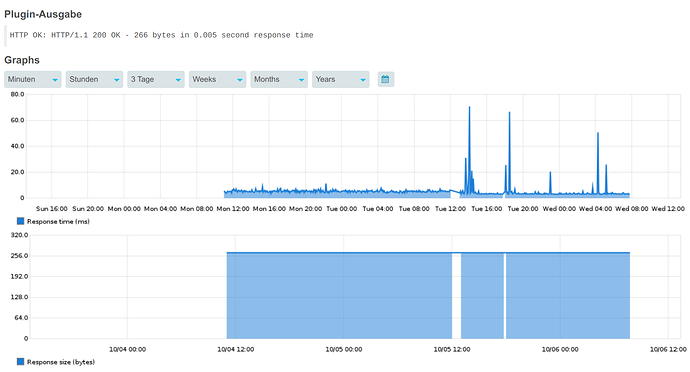
Graph BEFORE:

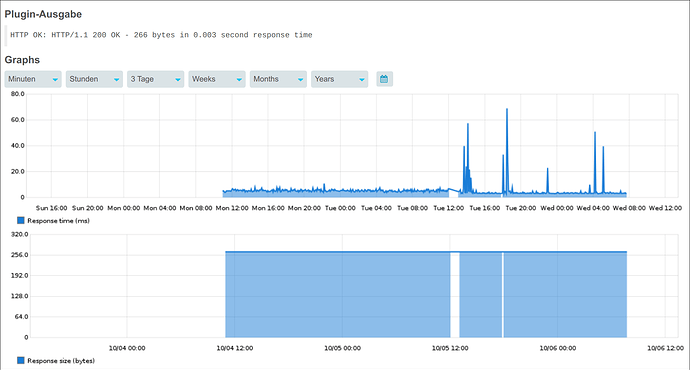
Graph AFTER stopping carbon-cache:

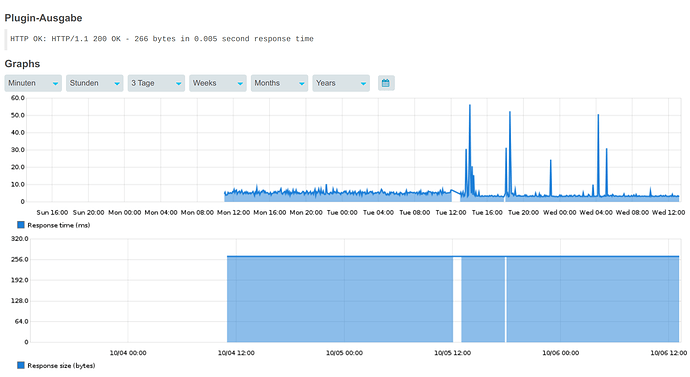
Graph after RESTARTING carbon-cache:

In the meantime I reinstalled the monitoring server.
Plain Debian 11 with icinga2 and graphite in a docker container.
And I’m STILL facing the same problem. doublesigh

The only changes I made to the graphite config:
In carbon.conf:

MAX_UPDATES_PER_SECOND = inf
MAX_CREATES_PER_MINUTE = inf

and storage-schemas.conf to:

[carbon]
pattern = ^carbon\.
retentions = 10s:6h,1m:90d

[default_1min_for_1day]
pattern = .*
retentions = 10s:6h,1m:6d,10m:1800d

[icinga2_internals]
pattern = ^icinga2\..*\.(max_check_attempts|reachable|current_attempt|execution_time|latency|state|state_type)
retentions = 5m:7d

[icinga2_2hourchecks]
pattern = ^icinga2\..*\.(apt|checkrestart)
retentions = 120m:4y

[icinga2_default]
pattern = ^icinga2\.
retentions = 1m:14d,5m:90d,30m:1y,120m:4y

[default]
pattern = .*
retentions = 1m:14d,5m:90d,30m:1y,120m:4y

I just can’t believe this is still happening. :frowning: :sob:

It cannot come from my Icinga config, can it?
So it must be because of the storage-schemas???

I suggest using graphite-web to confirm all of these observations - that could eliminate icinga2/web/modules very simply. I recently found an issue where some schemas were not updated and I was not sure why it looked like icinga2 was missing data. Also be sure to be running whisper-resize or deleting existing .wsp files when changing your schema.

The old server shows the same “holes”.
On the new server (with graphite in docker) graphite-web shows all metrics but no values at all.
Strange since icinga2 is showing at least the ones since the last reboot.

Thanks for reminding but I had done that.

Just to let you know: I’m giving up now.

I even talked to other Icinga + Graphite users during the OSMC conference last week.
And nobody has seen this problem before. Very strange. Maybe in a few years I’ll come back to Icinga 3(?) e.g. when it includes graphs by default. (Bernd Erk said they won’t implement that but he also said a few years ago there would never be a graphical config tool but now we have the Director :slight_smile: )

In the meantime I’ll switch to CheckMK for my productive systems.

Thanks a lot for trying to help me!
Andy

Hi,

i experienced the same problem this morning with ubuntu 20.04 LTS and graphite-carbon version “1.1.4-2 all”

in my case i saw the following “high frequency” exception in /var/log/carbon/console.log

12/05/2022 09:00:00 :: Unhandled Error
Traceback (most recent call last):
  File "/usr/lib/python3/dist-packages/twisted/python/threadpool.py", line 250, in inContext
    result = inContext.theWork()
  File "/usr/lib/python3/dist-packages/twisted/python/threadpool.py", line 266, in <lambda>
    inContext.theWork = lambda: context.call(ctx, func, *args, **kw)
  File "/usr/lib/python3/dist-packages/twisted/python/context.py", line 122, in callWithContext
    return self.currentContext().callWithContext(ctx, func, *args, **kw)
  File "/usr/lib/python3/dist-packages/twisted/python/context.py", line 85, in callWithContext
    return func(*args,**kw)
--- <exception caught here> ---
  File "/usr/lib/python3/dist-packages/carbon/writer.py", line 189, in writeForever
    writeCachedDataPoints()
  File "/usr/lib/python3/dist-packages/carbon/writer.py", line 98, in writeCachedDataPoints
    (metric, datapoints) = cache.drain_metric()
  File "/usr/lib/python3/dist-packages/carbon/cache.py", line 187, in drain_metric
    metric = self.strategy.choose_item()
  File "/usr/lib/python3/dist-packages/carbon/cache.py", line 116, in choose_item
    return next(self.queue)
builtins.StopIteration:

carbon-cache couldn’t write to disk and looses data during reboot.

Marc

1 Like

Thanks for this pointer!
I am seeing the same errors in my /var/log/carbon/console.log

This looks like the best approach to finding a real solution.
Unfortunately I don’t understand what this error means and what causes it.
Maybe a missing python library???

i see in the logfile that the first error is a little bit different and could be a hint

11/05/2022 09:01:07 :: Unhandled Error
Traceback (most recent call last):
  File "/usr/lib/python3/dist-packages/twisted/python/threadpool.py", line 250, in inContext
    result = inContext.theWork()
  File "/usr/lib/python3/dist-packages/twisted/python/threadpool.py", line 266, in <lambda>
    inContext.theWork = lambda: context.call(ctx, func, *args, **kw)
  File "/usr/lib/python3/dist-packages/twisted/python/context.py", line 122, in callWithContext
    return self.currentContext().callWithContext(ctx, func, *args, **kw)
  File "/usr/lib/python3/dist-packages/twisted/python/context.py", line 85, in callWithContext
    return func(*args,**kw)
--- <exception caught here> ---
  File "/usr/lib/python3/dist-packages/carbon/writer.py", line 189, in writeForever
    writeCachedDataPoints()
  File "/usr/lib/python3/dist-packages/carbon/writer.py", line 98, in writeCachedDataPoints
    (metric, datapoints) = cache.drain_metric()
  File "/usr/lib/python3/dist-packages/carbon/cache.py", line 187, in drain_metric
    metric = self.strategy.choose_item()
  File "/usr/lib/python3/dist-packages/carbon/cache.py", line 116, in choose_item
    return next(self.queue)
  File "/usr/lib/python3/dist-packages/carbon/cache.py", line 104, in _generate_queue
    metric_counts = sorted(self.cache.counts, key=lambda x: x[1])
  File "/usr/lib/python3/dist-packages/carbon/cache.py", line 161, in counts
    return [(metric, len(datapoints)) for (metric, datapoints) in self.items()]
  File "/usr/lib/python3/dist-packages/carbon/cache.py", line 161, in <listcomp>
    return [(metric, len(datapoints)) for (metric, datapoints) in self.items()]
builtins.RuntimeError: dictionary changed size during iteration

this happens 29 seconds after

11/05/2022 09:00:38 :: Starting factory <carbon.protocols.CarbonReceiverFactory object at 0x7fd4ea005760

during startup.

“dictionary changed size during iteration” sounds like timing or threading. but i’m no python expert.

Marc
perphaps i have seen the problem. i compared the sources of /usr/lib/python3/dist-packages/carbon/cache.py (graphite-carbon version “1.1.4-2 all”) with the current git version under https://github.com/graphite-project/carbon/blob/master/lib/carbon/cache.py

in the current version you see an additional locking in method _MetricCache.drain_metric(self)

--- /usr/lib/python3/dist-packages/carbon/cache.py.original     2018-09-04 00:46:18.000000000 +0200
+++ /usr/lib/python3/dist-packages/carbon/cache.py      2022-05-12 16:09:24.234617307 +0200
@@ -184,7 +184,8 @@
     if not self:
       return (None, [])
     if self.strategy:
-      metric = self.strategy.choose_item()
+      with self.lock:
+        metric = self.strategy.choose_item()
     else:
       # Avoid .keys() as it dumps the whole list
       metric = next(iter(self))

please see also

there is a second additional self.lock in “def store(…)”

Marc

1 Like

Great discovery! I added the two lines now and restarted carbon-cache.
First result: no more errors!
Now let’s wait a few days to see whether the values are really written to disk.

The fix is 3,5 years old! Unbelievable that it’s still not in the version of Debian 10 (buster).
Debian 11 (bullseye) ships with version 1.1.7-1 and has the fix included.

Maybe that’s why so few people are seeing this? But I would have thought that many are still on Debian 10 or Ubuntu 20.04 LTS

1 Like

Bad news: this patch does reduce the amount of errors in the console.log but after a restart of carbon-cache the history data is still lost. :frowning: