I am having an issue with a new installation of Icinga. I’m trying to add a working Graphite module.
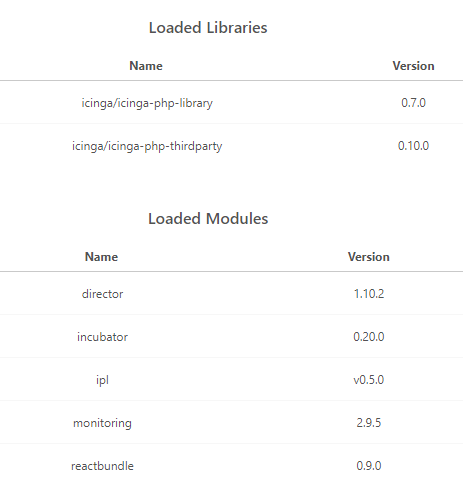
Director (1.10.2) is installed and requires icinga-php-library version 0.7.0
When I try to add Graphite, I get an error saying it requires icinga-php-library version 0.9.0
Once I upgrade icinga-php-library version, Director stops working correctly (Site displays as though it is still the 90s)
There are probably deprecated PHP commands used by Director’s PHP supported version that are not present with the new PHP version.
I am in a state that it seems I can’t have one (Director) with the other (Graphite).
I’ve read through all kinds of posts and threads, but there wasn’t any solution I’ve managed to apply to my understanding.
Any help would be very much appreciated.
OS: Oracle Linux 8.8
Icinga Web 2 Version 2.9.5
PHP Version 7.4.33
Director 1.10.2
ipl v0.5.0
So either icinga-php-library 0.7.0 or 0.9.0 work fine. We have 0.9.0 installed.
If I remember correctly you need to cache-reload(CTRL+F5 or CTRL+SHIFT+R) your browser after you installed PHP related stuff. Maybe even restart apache2/httpd/nginx/php-fpm.
Icinga Director was also published as a package some time ago, so you can install it via your package manager including all the necessary dependencies (apart from the incubator module)
Took me a while to test, but it seems that no matter what service I restart (httpd, icinga2, php-fpm), the site display remains in its horrible 90s vibe. It is only when I go back to icinga-php-library 0.7.0 that the site gets back to its usual “self”. I even tried from computers that did not access the site before.
Director a side, Graphite installation by itself is not very clear to me.
I desperately need a step-by-step guide (for dummies preferably ) for installing Graphite as there are too many dependencies and configurations to be done.
To be honest, I’m mostly done with Graphite. The setup is fiddly with its many components.
This HowTo worked pretty well the last time I used it:
Or maybe check if you find a HowTo to run graphite in a docker container, that way you have it easier with the whole lot of components/dependencies.
Or you switch to InfluxDB and Grafana, which I am doing for all new setups.
It is pretty easy to set up (both InfluxDB2 and Grafana) and more powerful in regards to dashboards.
Thanks again for the reply and sorry for the late response as I was on a short sick-leave.
Yes, I’ve tried installing Graphite 1.2.3 version, but this is when everything goes sideways.
Graphite 1.2.3 module requires PHP library version 0.9.0 but Director is unable to work with anything newer than 0.7.0.
Switching to another graphing module is problematic, as I have a lot of history on the old server which is using Graphite and I want to try and import it once I’m able to figure how to make it work.
Thanks for letting me know about the manual. I will try it and update soon.
check if any other module really needs the old ipl module
remove ipl it is deprecated as a module.
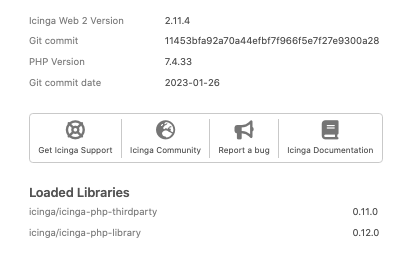
install icinga-php-library via package manager (v0.12) or check if it is installed
that is still strange to me.
Did you checkout v1.10.2 of the director? Or are you using the master branch (or did sometime in the past) and maybe that could cause problems?
You can safely remove the /usr/share/icingaweb2/modules/director directory and make a new git clone (or install it via package) to not have any old remains hanging around.
This is a brand-new server with a new Icinga installation, so no old versions are lying around.
I think that ipl v0.5.0 and icinga/icinga-php-library 0.7.0 are somehow connected (icinga-php-library = ipl).
If I try to mess with any of them then Director site stops displaying correctly.
Sadly, I’ve also had some difficulties from the start with the guide, as some of the pip related commands are not working anymore due to security changes.
I meant this guide you’ve mentioned earlier in this thread:
These 3 pip commands appear right at the beginning of this guide, and are supposed to be run on the graphite environment:
The first command runs without an issue as it is only upgrading pip related components.
When running the other two commands I get an error that changing the install-lib is no longer supported.
I’m not a python/pip expert and have no idea how to rebuild these commands to make this work
Ah, yes. Forgot that I mentioned that.
But that is only for the graphite components.
The Director and Graphite module should work regardless of the way you have chosen to set up the graphite stuff.
As said I’m done with graphite as a whole, so can’t help there.
Just keep in mind that if you want to use historical data from a different graphite setup the storage-schema has to be the same on both instances, so the data can be read and written. (afaik)
To sum up, because I have lost oversight:
Graphite module v1.2.3 installed via git
Director module v.1.10.2 installed via git
You could try installating both modules via packages instead of git
Something I overlooked: Icinga Web 2 and icinga-php-library come via packages. Is there any reason they are not installed in the latest versions?
After a few trails installing Graphite or Influxdb and Grafana, I’ve realized that the main issue is that there have been so many changes with the versions out there, that by the time a guide is written on how to install the modules, it is no longer valid.
For example, the documentation found regarding influxdb mentions the use of the command influx to create icinga2 database, but the shell is not present with influxdb2.
If I try to downgrade and continue using the guide, I’m presented with other problems from compatibility issues to other commands that are no longer valid.
Has anyone succeeded in installing and configuring any working graphing engine recently?
I seem to be missing something to make it work.
install influxdb2 and influxdb2-cli.
This will set up a running instance on :8086 and there you can complete the setup.
First login is with admin:admin (iirc) and then you configure a new password.
After that comes the organization and bucket related setup.
Then you can create an API token for your bucket and put it in the feature config for icinga.
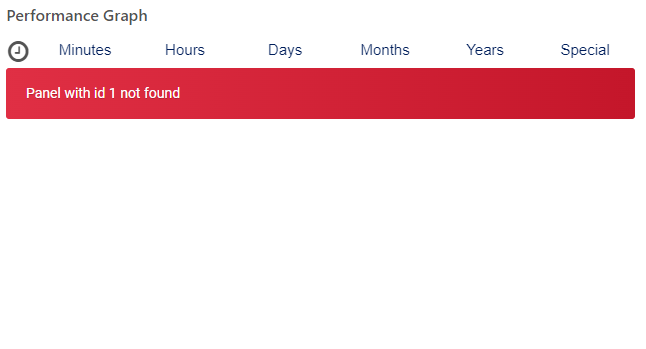
I’ve managed to make some progress, but I’ve encountered a problem which I don’t understand.
The following error is shown instead of graphs and the number id may vary:
Where did I go wrong with the configuration or what have I missed?
I don’t even know what to add as debug info.
in influxdb2 you have buckets instead of databases.
the whole creation of buckets, setting the retention period and creating the required API token for the icinga2 feature can be done via the webinterface.
no, afaik
icinga2 sends perfdata to influx(2) via influxdb(2) feature, grafana needs to access (read) influx to create dashboards with graphs. InfluxDB2 uses a new query language Flux instead of InfluxQL with InfluxDB1
in the influxdb2 webinterface you have the option to create queries click-by-click and than use that query in your grafana dashboard.
I’ve finally managed to get to a situation in which I’m presented with an empty graph.
I guess that now the queries’ part you’ve mentioned come into play. I have no idea where to begin and how to configure these queries nor where (Grafana side or InfluxDB side).
I don’t even know how to check if the configurations I’ve made really do something, as I’ve not found where InfluxDB stores the actual data.
Sorry if I ask a lot of questions but this is my first time installing this software combo, and I’ve yet to find a guide that covers the whole process.
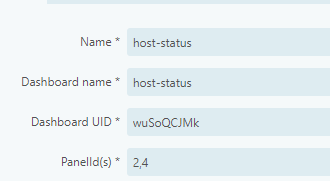
create a new dashboard, add variables (constants) to it named hostname, service and command and then create a new panel with the above “code” as Flux query (replace bucket name with yours)