I’ve fiddled around with InfluxDB and Grafana settings but I don’t fully understand the connection between the two.
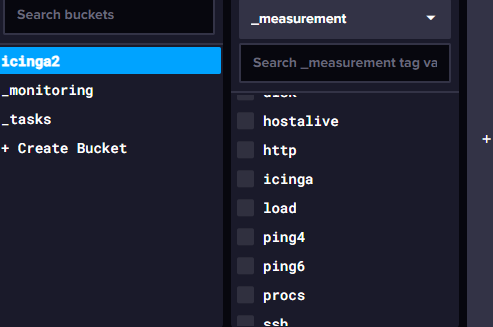
I can see that on InfluxDB the data populates like so under meausrement:
From there I’m in a bit of a loss. I’ve tried to create a dashboard and save various queries, but whatever I do, it doesn’t seem to effect the graphs under grafana. The graphs remain with “no data”.
When trying to use your code, I get an error “undefined identifier”. Where do I define these identifiers and are they considered as varibles?
How did you manage to undertand and configure all these components?
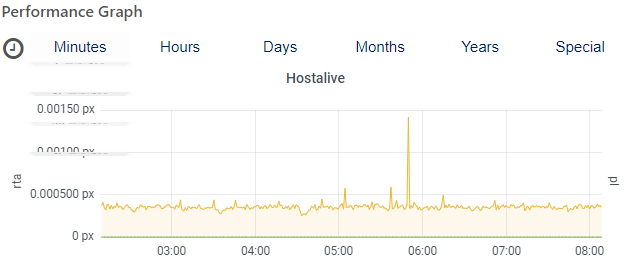
Just an update: I think I’ve made it - at least one graph is working.
I’ve finally figured it out, that you have to build the query with the help of Influxdb query builder and then paste it into the Grafana designated graph on the dashboard.
The weird thing is that when trying to pick a hostname at topmost section I am presented only with the option “None”, I supposedly should be able to pick the hostname and see all the relevant graphs for that hostname on the dashboard.
Even so, the only graph that I’ve managed to configure is proudly displayed on each host.
I am hopeful that I will fully understand how to use these variables, as I’ve done many trials and errors until it has somehow started working (on Icinga, but not on Grafana’s dashboard)
Best and thanks for all the tips and pointers,
A with-graph IT guy.
This way is valid, but you then have a hardcoded graph for just that one host & service combination.
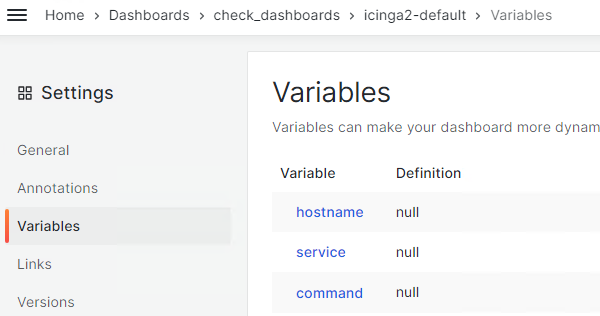
For that you would have to change the hostname variable in the grafana dashboard to a “query” and then create a query that yields your desired set of hostnames.
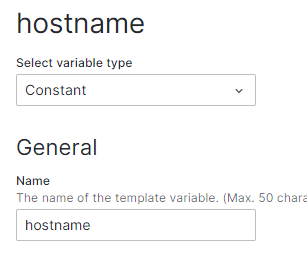
Drawback of this is that you don’t have a “dynamic” graph in the webinterface that always fits the host you are looking at. That is what the method with the constant variable does, as this variable is always filled with the hostname you are currently displaying (${hostname} in my example).
You have to create “constant” variables with the names hostname, service and command in the settings section of your dashboard.
What version of Influxdb and Grafana did you install? The latest IcingaWeb2 Grafana module release v2.0.3 doesn’t support IcingaWeb v2.9.5 which is what I have at the moment (You mentioned you have this same release in your env).
I’m still having difficulties setting up the graphs as I would like to, so it may very well be due to version incompatibility (or user’s [my] understanding of the system - or rather the lack of it )