Hello everyone,
I have a problem I can not solve on my own again. My Icinga Web 2 is not showing my Grafana Graphs.
To my setup: I have a master on which the Grafana Web Plugin is running. A host on which InfluxDB is running is connected to the master and getting information from the master as visible with the Grafana-Icinga-Metrics and a Chronograf. So this way the communication definitely works. This host does have the full Grafana up to date installation and is also used for other Grafana-Dashboards. I made the icinga2-default Dashboard and have this configuration set up in Icinga Web 2:
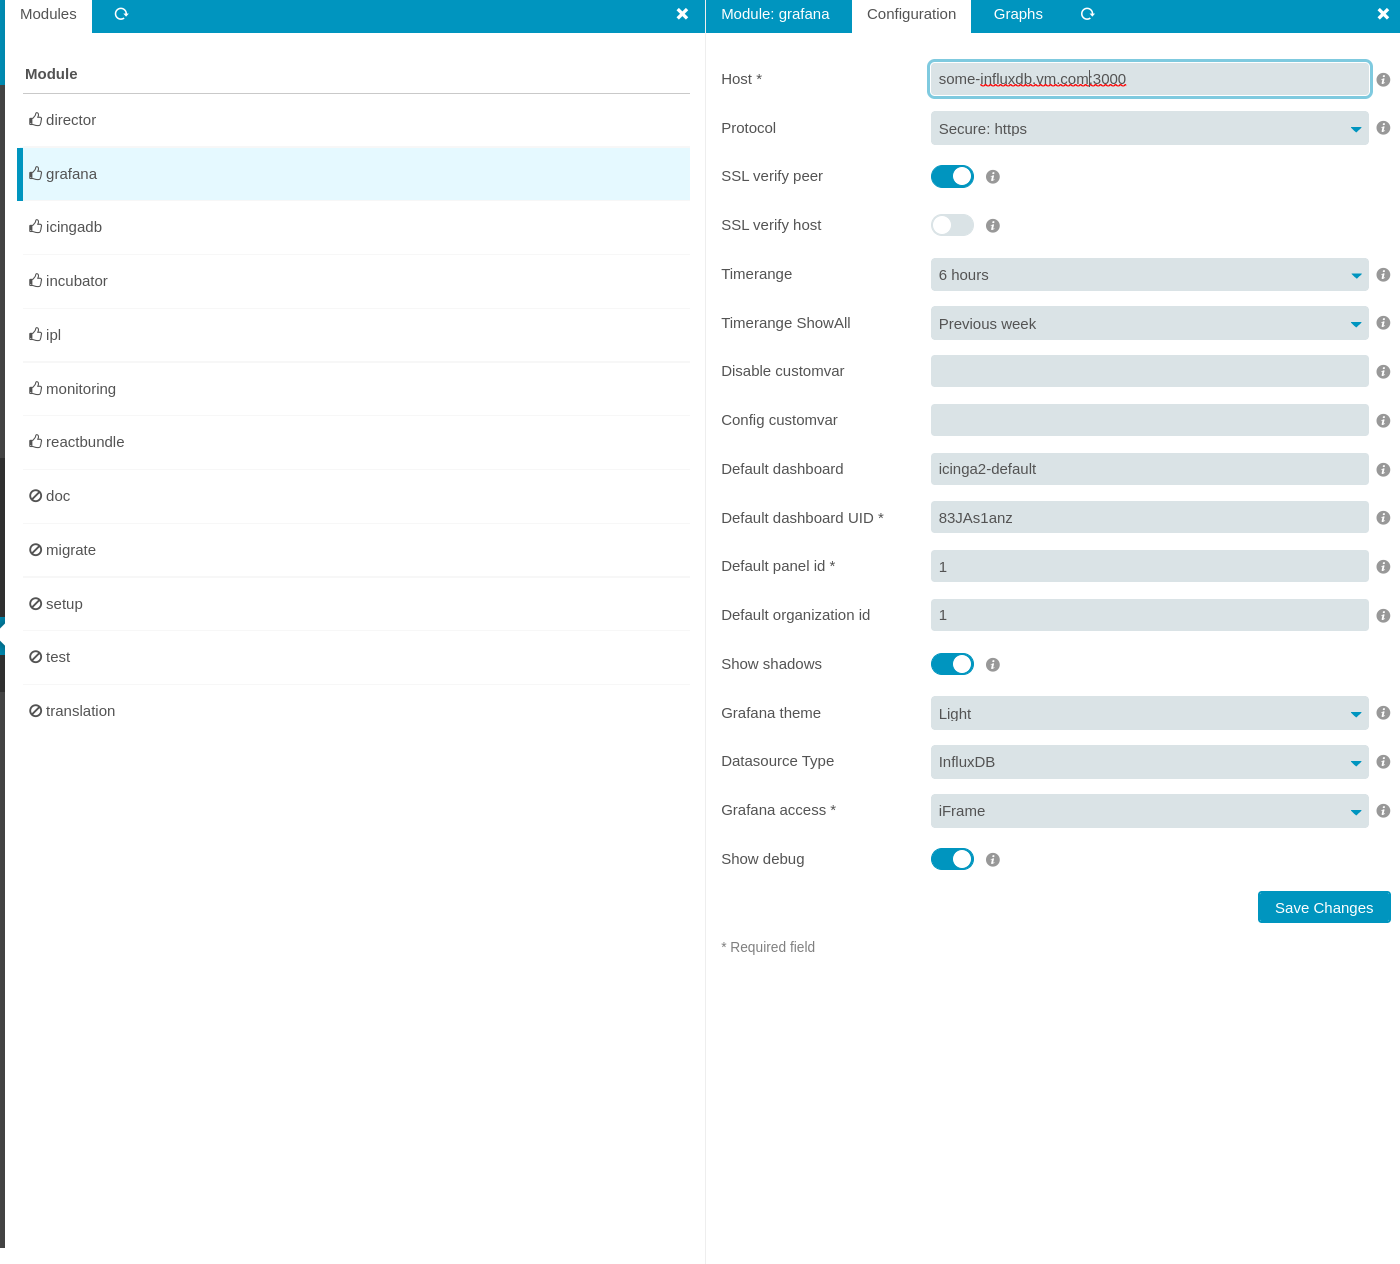
So far everything seems fine but as soon as I try to view a graph in a service I will get this error in the browser inspector:
Refused to display 'https://some-influxdb.com:3000/' in a frame because it set 'X-Frame-Options' to 'deny'.
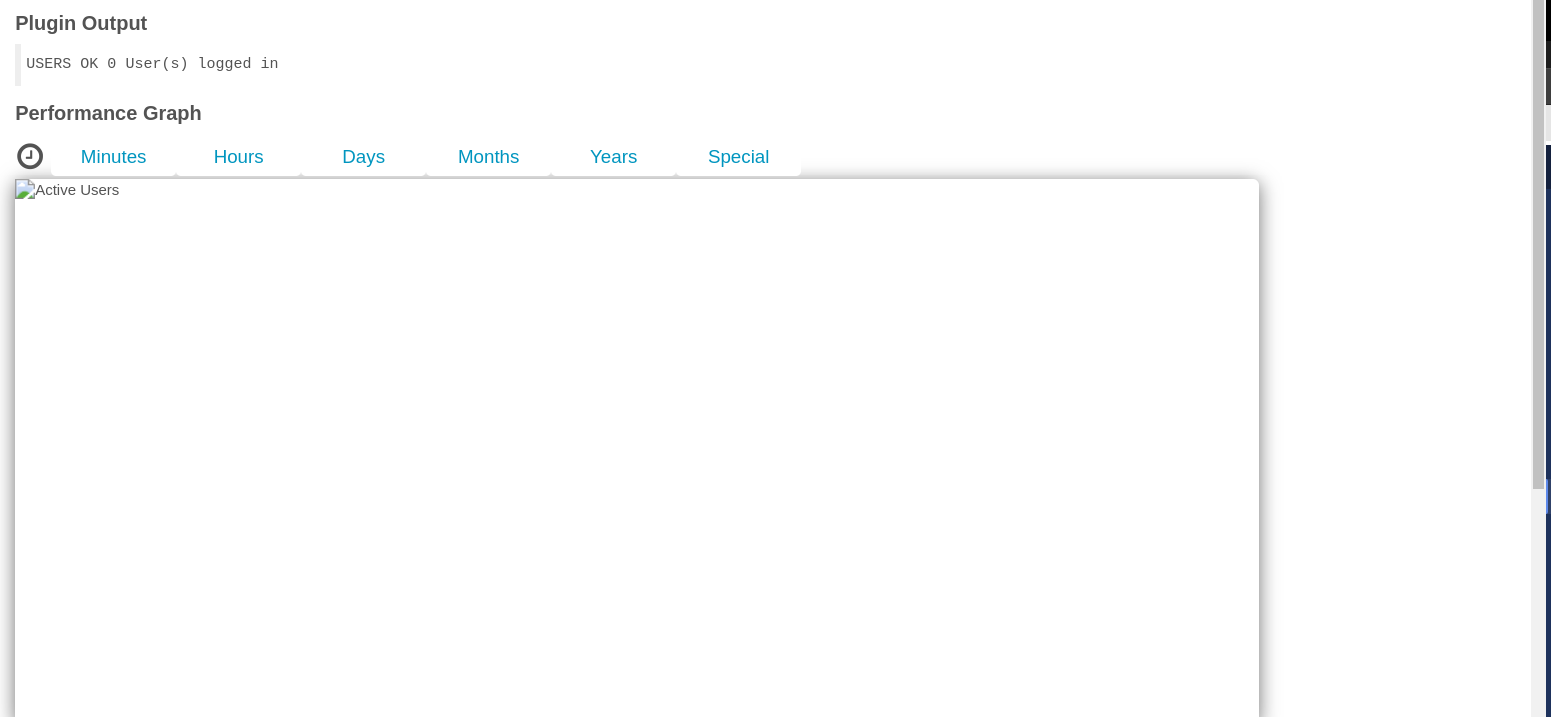
And if I now would set the iFrame to Indirect Proxy I get this displayed where the graphs should have been:

So after talking to my colleagues we figured that the problem as stated here is the self signed certificate which we can’t fetch with curl. Does anyone know how and/or where I could fix this?
Thanks in advance,
best Regards.