Hello!
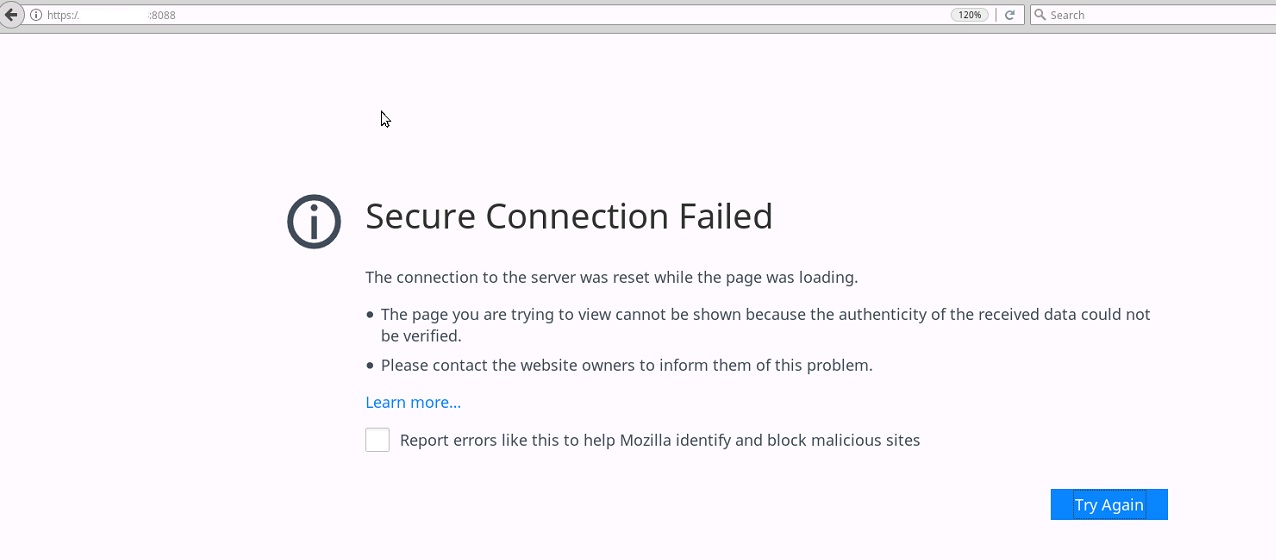
In the installation steps, this is shown. I feel like this could be my issue. The port influxd is listening to in my environment is 8088 so I tried http://localhost:8088, no luck. I get this:

tks.
Hello!
In the installation steps, this is shown. I feel like this could be my issue. The port influxd is listening to in my environment is 8088 so I tried http://localhost:8088, no luck. I get this:
tks.
grafana usually listens on port 3000.
Just to make sure, you have grafana server installed, do you?
Simply connecting the icingaweb2-grafana module to influxdb won’t work.
Well I installed the module? I guess not…
Installation steps are all over the place. Every site has different ones. What should I follow?
Also I just want simple graphs under services and hosts, that’s it. Maybe this is way too much?
No, it isn’t. There are some modules out there for graphs and the influxdb/grafana stack is the best in my eyes, and still quite easy to set up. PNP4Nagios was good back in the days and I somehow miss the simple reporting engine but it was a pain in the socks when it came to accessing the raw data or changing the number of rows inside a database file. Corrupted databases all the time.
Graphite is a PITA too, especially because it doesn’t like a change of check intervals.
–
Install grafana from the grafana repository https://grafana.com/docs/installation/rpm/
The default config is ok for getting started, so just start grafana-server (that’s on RedHat, dunno if the name is the same in Debian-Land)
Navigate to http://yourmonitoringserver:3000 and add a datasource icinga2-influxdb
Getting the name right is important, the dashboards that come with the icingaweb2-module require the name.
When this is done, import the dashboard icinga2-default.json into grafana.
You don’t need the base-metrics.json.
Visit the dashboard and take note of the dashboard ID, that’s the random string in the URL. You’ll need it in the module configuration. The dashboard itself will show nothing in this state, it’ll complain about no data and stuff, that’s normal because all the variables aren’t set yet, the icingaweb2 module takes care of it.
Thank you for your explanations. They were very good and I got pretty far I think. I’ve installed InfluxDB and created a data source.I’m now at the Dashboard section and confused…yet again! 
Not sure how to proceed.
One thing I also noticed is that I enabled the module in Icingaweb but it looks “empty”. The version is 0.0.0 and I don’t have the Configuration tab anymore.
I did download the deb package (although I’m on Ubuntu…it says Ubuntu/Debian…) and enabled Grafana. (https://grafana.com/docs/installation/debian/)
Should I also install the tar file?
uhm, which tar file?
You need to import this dashboard into Grafana and make sure it is referencing to the correct datasource: https://raw.githubusercontent.com/Mikesch-mp/icingaweb2-module-grafana/master/dashboards/influxdb/icinga2-default.json
Regarding the icingaweb2 module, I don’t know the state and version of the debian packages (and with debian, I mean ubuntu too). I always clone the modules directly from the github project. The installation instructions for the grafana module are pretty clear and the git install is actually the easiest to use and update.
In your place, I would uninstall (purge) the package for the module and clone from git.
For the sake of completeness of this post, here a link to the install instructions https://github.com/Mikesch-mp/icingaweb2-module-grafana/blob/master/doc/02-installation.md
Ok I got it. I see it now.
Now instead of the graph I have this type of error message under my host/services. Could it be my authentication?
Your screenshot shows only half of the truth, could you post the content of /etc/icingaweb2/modules/grafana/config.ini?
The message looks like an ssl error, have you set up grafana to use ssl?
It could be authentication too, depending on how you have set up your grafana.
Try to use other access methods and auth options.
For example, I have set up a second organization in grafana which allows anonymous access and shows only the icinga2-default dashboard, and I use indirect proxy as access method.
The first screenshot looks like a problem with php curl and its OpenSSL / NSS implementation. Which PHP version is used here? And which base system is used for running InfluxDB/Grafana?
Hi guys,
I am using PHP 7.2.24-0 on Ubuntu 18.04.1.
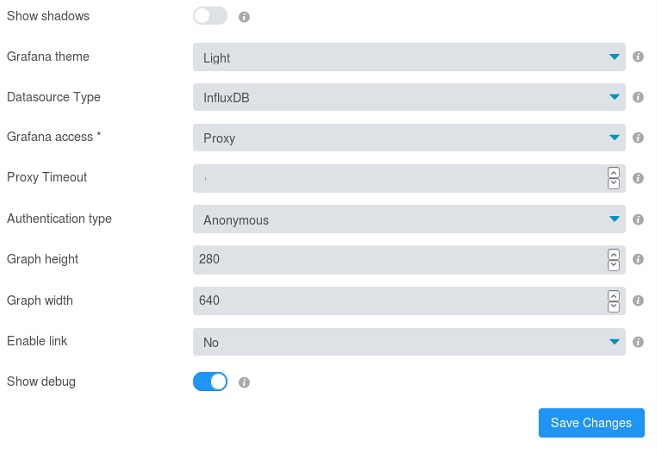
This is my config.ini :
[grafana]
version = “1”
host = “myserverip:8086”
protocol = “https”
ssl_verifypeer = “0”
ssl_verifyhost = “0”
timerangeAll = “1w/w”
defaultdashboard = “icinga2-default”
defaultdashboarduid = “kunjRvaZz”
defaultdashboardpanelid = “1”
defaultorgid = “1”
shadows = “0”
theme = “light”
datasource = “influxdb”
accessmode = “proxy”
debug = “1”
proxytimeout = “5”
authentication = “anon”
height = “280”
width = “640”
enableLink = “no”
I tried other authentications, I’ll try again.
Which TLS certificate are you using on the InfluxDB server?
Try it with
openssl s_client -connect myserverip:8086
and post the details. You could also use sslscan as tool, if you prefer that.
Cheers,
Michael
CONNECTED(00000005)
139712456495552:error:1408F10B:SSL routines:ssl3_get_record:wrong version number:…/ssl/record/ssl3_record.c:332:no peer certificate available
No client certificate CA names sent
SSL handshake has read 5 bytes and written 315 bytes
Verification: OKNew, (NONE), Cipher is (NONE)
Secure Renegotiation IS NOT supported
Compression: NONE
Expansion: NONE
No ALPN negotiated
Early data was not sent
Verify return code: 0 (ok)
I see the same error message I get in Icinga…
Hm, ok. Then navigate into your file tree where the certificates are located and do the following:
openssl x509 -in influxdbserver.crt -text
Oops…It looks like I don’t have the certificate…
/usr/share/ssl-cert# openssl x509 -in influxdbserver.crt -text
Can’t open influxdbserver.crt for reading, No such file or directory
139700663685568:error:02001002:system library:fopen:No such file or directory:…/crypto/bio/bss_file.c:72:fopen(‘influxdbserver.crt’,‘r’)
139700663685568:error:2006D080:BIO routines:BIO_new_file:no such file:…/crypto/bio/bss_file.c:79:
unable to load certificate
influxdbserver is your hostname, or how the certificate name path is configured in your influxdb config. I don’t know that
Wow that was not my best one…
I found it…
Blockquote
Certificate:
Data:
Version: 3 (0x2)
Serial Number: 1543680614 (0x5c02b266)
Signature Algorithm: sha1WithRSAEncryption
Issuer: C = US, CN = , O = , OU = Unknown, ST = Unknown, L = Unknown
Validity
Not Before: Dec 1 16:10:14 2018 GMT
Not After : Nov 28 16:10:14 2028 GMT
Subject: C = US, CN = , O = , OU = Unknown, ST = Unknown, L = Unknown
Subject Public Key Info:
Public Key Algorithm: rsaEncryption
RSA Public-Key: (2048 bit)
Modulus:
00:ef:fb:d1:39:cf:ec:39:8f:85:04:06:91:a6:e4:
5a:b1:e4:50:43:e1:1c:fa:fc:3d:ba:f1:0c:fe:91:
13:24:3b:29:cf:9a:a8:8c:7c:73:67:a1:c2:9f:3a:
ed:6f:fb:a3:ae:1d:49:bd:54:c1:69:4b:38:d4:df:
a9:05:b7:a0:a5:9c:d8:a8:35:3b:7d:2a:77:e3:6c:
b5:93:b6:43:cb:81:df:21:ac:57:25:46:c3:28:ca:
d1:44:07:96:dc:0b:13:00:d0:f7:f5:ff:6c:09:1f:
25:3e:c1:48:8d:51:64:2e:78:75:e3:24:3f:82:bb:
ca:71:5d:31:3b:31:4b:1f:64:6a:0b:e8:cd:45:d2:
c0:1d:c0:70:ff:89:ce:8f:61:6b:ef:4e:19:7a:c2:
fb:42:a8:d0:4b:c1:4c:66:77:f4:3f:bb:40:da:d5:
d0:32:42:82:ad:2c:f7:7e:8c:5a:4b:42:f9:05:95:
6b:e2:a6:55:66:95:f0:95:24:c0:82:1d:06:54:ee:
f3:37:3e:a3:20:6c:bf:1e:4e:c7:45:92:11:e8:89:
42:0a:dc:28:a6:c3:c4:ee:22:e3:f7:80:96:d9:fc:
94:66:5e:96:9c:a8:cf:6c:ec:ea:14:5f:10:12:c0:
a1:5a:1e:3f:80:28:2e:55:1e:f8:7f:a5:82:1b:13:
57:55
Exponent: 65537 (0x10001)
X509v3 extensions:
X509v3 Basic Constraints: critical
CA:FALSE
X509v3 Extended Key Usage:
TLS Web Server Authentication
X509v3 Key Usage: critical
Key Encipherment
X509v3 Subject Key Identifier:
E9:CA:BE:E6:DE:CA:55:F6:64:37:D3:71:65:6F:3D:C6:5B:77:2F:D1
Signature Algorithm: sha1WithRSAEncryption
85:1d:48:7c:4d:c0:be:4d:7d:fe:73:05:ab:e2:32:72:d2:dd:
8f:73:ce:14:01:79:89:6f:62:cd:2b:84:56:98:bf:da:0c:87:
87:e9:e2:ed:f8:29:2f:94:e1:eb:b3:40:a2:f1:d0:f0:92:44:
bf:d1:5a:d3:13:36:19:2b:68:32:05:5a:09:9b:69:c3:f6:ce:
db:95:d0:f2:f2:4f:f5:5a:0e:be:65:a6:28:53:b4:23:78:68:
d4:9f:4c:4c:c7:ca:78:2f:45:c6:10:ec:6e:37:e2:d9:a0:46:
a3:9f:19:aa:41:13:bd:0e:c7:f2:ed:63:49:35:18:0d:2a:0f:
e0:33:a6:af:59:0b:35:ec:67:95:3a:47:ae:f9:da:6b:70:8b:
d1:d9:3d:b8:b1:fc:8e:43:ff:c2:76:81:bd:01:22:1c:ce:a0:
ce:a1:37:5f:94:2e:f8:92:5d:fd:ae:4b:df:80:df:ff:7b:f8:
bc:0c:74:bc:11:0e:de:ae:ba:a3:69:15:5a:bc:1b:6e:29:a6:
63:5a:85:aa:2a:e2:12:c3:75:f8:fc:8b:76:97:9d:4e:53:c1:
4d:c2:10:3e:f7:e0:55:10:f9:f6:33:81:ef:c1:cb:60:2d:6d:
df:0e:5f:66:72:f6:5a:0a:40:39:44:df:77:8f:30:57:26:aa:
19:c9:dc:49
-----BEGIN CERTIFICATE-----
MIID7zCCAtegAwIBAgIEXAKyZjANBgkqhkiG9w0BAQUFADCBjTELMAkGA1UEBhMC
VVMxIzAhBgNVBAMTGm1vbml0b3ItaHBjaTMuY21jLmVjLmdjLmNhMSMwIQYDVQQK
Exptb25pdG9yLWhwY2kzLmNtYy5lYy5nYy5jYTEQMA4GA1UECxMHVW5rbm93bjEQ
MA4GA1UECBMHVW5rbm93bjEQMA4GA1UEBxMHVW5rbm93bjAeFw0xODEyMDExNjEw
MTRaFw0yODExMjgxNjEwMTRaMIGNMQswCQYDVQQGEwJVUzEjMCEGA1UEAxMabW9u
aXRvci1ocGNpMy5jbWMuZWMuZ2MuY2ExIzAhBgNVBAoTGm1vbml0b3ItaHBjaTMu
Y21jLmVjLmdjLmNhMRAwDgYDVQQLEwdVbmtub3duMRAwDgYDVQQIEwdVbmtub3du
MRAwDgYDVQQHEwdVbmtub3duMIIBIjANBgkqhkiG9w0BAQEFAAOCAQ8AMIIBCgKC
AQEA7/vROc/sOY+FBAaRpuRaseRQQ+Ec+vw9uvEM/pETJDspz5qojHxzZ6HCnzrt
b/ujrh1JvVTBaUs41N+pBbegpZzYqDU7fSp342y1k7ZDy4HfIaxXJUbDKMrRRAeW
3AsTAND39f9sCR8lPsFIjVFkLnh14yQ/grvKcV0xOzFLH2RqC+jNRdLAHcBw/4nO
j2Fr704ZesL7QqjQS8FMZnf0P7tA2tXQMkKCrSz3foxaS0L5BZVr4qZVZpXwlSTA
gh0GVO7zNz6jIGy/Hk7HRZIR6IlCCtwopsPE7iLj94CW2fyUZl6WnKjPbOzqFF8Q
EsChWh4/gCguVR74f6WCGxNXVQIDAQABo1UwUzAMBgNVHRMBAf8EAjAAMBMGA1Ud
JQQMMAoGCCsGAQUFBwMBMA8GA1UdDwEB/wQFAwMHIAAwHQYDVR0OBBYEFOnKvube
ylX2ZDfTcWVvPcZbdy/RMA0GCSqGSIb3DQEBBQUAA4IBAQCFHUh8TcC+TX3+cwWr
4jJy0t2Pc84UAXmJb2LNK4RWmL/aDIeH6eLt+CkvlOHrs0Ci8dDwkkS/0VrTEzYZ
K2gyBVoJm2nD9s7bldDy8k/1Wg6+ZaYoU7QjeGjUn0xMx8p4L0XGEOxuN+LZoEaj
nxmqQRO9Dsfy7WNJNRgNKg/gM6avWQs17GeVOkeu+dprcIvR2T24sfyOQ//CdoG9
ASIczqDOoTdflC74kl39rkvfgN//e/i8DHS8EQ7errqjaRVavBtuKaZjWoWqKuIS
w3X4/It2l51OU8FNwhA+9+BVEPn2M4HvwctgLW3fDl9mcvZaCkA5RN93jzBXJqoZ
ydxJ
-----END CERTIFICATE-----
Hi,
and you’re 100% certain that 8086 really serves TLS? Can you please share the full InfluxDB configuration file.
Cheers,
Michael
Hi,
For the module configuration you have to use the default grafana port 3000 (unless you have changed it to an other port), looks like you are using the influx default port. The connection is:
icingaweb2-grafana-module ↔ Grafana ↔ InfluxDB
Also some tips:
Indirect Proxy as Grafana access to speed up the page loadGreetz
Welcome to the InfluxDB configuration file.
The values in this file override the default values used by the system if
a config option is not specified. The commented out lines are the the configuration
field and the default value used. Uncommentting a line and changing the value
will change the value used at runtime when the process is restarted.Once every 24 hours InfluxDB will report usage data to usage.influxdata.com
The data includes a random ID, os, arch, version, the number of series and other
usage data. No data from user databases is ever transmitted.
Change this option to true to enable reporting.
reporting-enabled = falsewe’ll try to get the hostname automatically, but if it the os returns something
that isn’t resolvable by other servers in the cluster, use this option to
manually set the hostname
hostname = “localhost”[meta]
Controls the parameters for the Raft consensus group that stores metadata
about the InfluxDB cluster.[meta]
Where the metadata/raft database is stored
dir = “/var/lib/influxdb/meta”Automatically create a default retention policy when creating a database.
retention-autocreate = trueIf log messages are printed for the meta service
logging-enabled = true[data]
Controls where the actual shard data for InfluxDB lives and how it is
flushed from the WAL. “dir” may need to be changed to a suitable place
for your system, but the WAL settings are an advanced configuration. The
defaults should work for most systems.[data]
The directory where the TSM storage engine stores TSM files.
dir = “/var/lib/influxdb/data”The directory where the TSM storage engine stores WAL files.
wal-dir = “/var/lib/influxdb/wal”Trace logging provides more verbose output around the tsm engine. Turning
this on can provide more useful output for debugging tsm engine issues.
trace-logging-enabled = falseWhether queries should be logged before execution. Very useful for troubleshooting, but will
log any sensitive data contained within a query.
query-log-enabled = trueSettings for the TSM engine
CacheMaxMemorySize is the maximum size a shard’s cache can
reach before it starts rejecting writes.
cache-max-memory-size = 1048576000CacheSnapshotMemorySize is the size at which the engine will
snapshot the cache and write it to a TSM file, freeing up memory
cache-snapshot-memory-size = 26214400CacheSnapshotWriteColdDuration is the length of time at
which the engine will snapshot the cache and write it to
a new TSM file if the shard hasn’t received writes or deletes
cache-snapshot-write-cold-duration = “10m”CompactFullWriteColdDuration is the duration at which the engine
will compact all TSM files in a shard if it hasn’t received a
write or delete
compact-full-write-cold-duration = “4h”The maximum series allowed per database before writes are dropped. This limit can prevent
high cardinality issues at the database level. This limit can be disabled by setting it to
0.
max-series-per-database = 1000000The maximum number of tag values per tag that are allowed before writes are dropped. This limit
can prevent high cardinality tag values from being written to a measurement. This limit can be
disabled by setting it to 0.
max-values-per-tag = 100000[coordinator]
Controls the clustering service configuration.
[coordinator]
The default time a write request will wait until a “timeout” error is returned to the caller.
write-timeout = “10s”The maximum number of concurrent queries allowed to be executing at one time. If a query is
executed and exceeds this limit, an error is returned to the caller. This limit can be disabled
by setting it to 0.
max-concurrent-queries = 0The maximum time a query will is allowed to execute before being killed by the system. This limit
can help prevent run away queries. Setting the value to 0 disables the limit.
query-timeout = “0s”The the time threshold when a query will be logged as a slow query. This limit can be set to help
discover slow or resource intensive queries. Setting the value to 0 disables the slow query logging.
log-queries-after = “0s”The maximum number of points a SELECT can process. A value of 0 will make the maximum
point count unlimited.
max-select-point = 0The maximum number of series a SELECT can run. A value of 0 will make the maximum series
count unlimited.The maximum number of series a SELECT can run. A value of zero will make the maximum series
count unlimited.
max-select-series = 0The maxium number of group by time bucket a SELECt can create. A value of zero will max the maximum
number of buckets unlimited.
max-select-buckets = 0[retention]
Controls the enforcement of retention policies for evicting old data.
[retention]
Determines whether retention policy enforcment enabled.
enabled = trueThe interval of time when retention policy enforcement checks run.
check-interval = “30m”[shard-precreation]
Controls the precreation of shards, so they are available before data arrives.
Only shards that, after creation, will have both a start- and end-time in the
future, will ever be created. Shards are never precreated that would be wholly
or partially in the past.[shard-precreation]
Determines whether shard pre-creation service is enabled.
enabled = trueThe interval of time when the check to pre-create new shards runs.
check-interval = “10m”The default period ahead of the endtime of a shard group that its successor
group is created.
advance-period = “30m”Controls the system self-monitoring, statistics and diagnostics.
The internal database for monitoring data is created automatically if
if it does not already exist. The target retention within this database
is called ‘monitor’ and is also created with a retention period of 7 days
and a replication factor of 1, if it does not exist. In all cases the
this retention policy is configured as the default for the database.[monitor]
Whether to record statistics internally.
store-enabled = trueThe destination database for recorded statistics
store-database = “_internal”The interval at which to record statistics
store-interval = “10s”[admin]
Controls the availability of the built-in, web-based admin interface. If HTTPS is
enabled for the admin interface, HTTPS must also be enabled on the [http] service.NOTE: This interface is deprecated as of 1.1.0 and will be removed in a future release.
[admin]
Determines whether the admin service is enabled.
enabled = falseThe default bind address used by the admin service.
bind-address = “:8083”Whether the admin service should use HTTPS.
https-enabled = falseThe SSL certificate used when HTTPS is enabled.
https-certificate = “/etc/ssl/influxdb.pem”[http]
Controls how the HTTP endpoints are configured. These are the primary
mechanism for getting data into and out of InfluxDB.[http]
Determines whether HTTP endpoint is enabled.
enabled = trueThe bind address used by the HTTP service.
bind-address = “:8086”Determines whether HTTP authentication is enabled.
auth-enabled = falseThe default realm sent back when issuing a basic auth challenge.
realm = “InfluxDB”Determines whether HTTP request logging is enable.d
log-enabled = trueDetermines whether detailed write logging is enabled.
write-tracing = falseDetermines whether the pprof endpoint is enabled. This endpoint is used for
troubleshooting and monitoring.
pprof-enabled = trueDetermines whether HTTPS is enabled.
https-enabled = falseThe SSL certificate to use when HTTPS is enabled.
https-certificate = “/etc/ssl/influxdb.pem”Use a separate private key location.
https-private-key = “”The JWT auth shared secret to validate requests using JSON web tokens.
shared-sercret = “”The default chunk size for result sets that should be chunked.
max-row-limit = 10000The maximum number of HTTP connections that may be open at once. New connections that
would exceed this limit are dropped. Setting this value to 0 disables the limit.
max-connection-limit = 0Enable http service over unix domain socket
unix-socket-enabled = falseThe path of the unix domain socket.
bind-socket = “/var/run/influxdb.sock”[subscriber]
Controls the subscriptions, which can be used to fork a copy of all data
received by the InfluxDB host.[subscriber]
Determines whether the subscriber service is enabled.
enabled = trueThe default timeout for HTTP writes to subscribers.
http-timeout = “30s”Allows insecure HTTPS connections to subscribers. This is useful when testing with self-
signed certificates.
insecure-skip-verify = falseThe path to the PEM encoded CA certs file. If the empty string, the default system certs will be used
ca-certs = “”The number of writer goroutines processing the write channel.
write-concurrency = 40The number of in-flight writes buffered in the write channel.
write-buffer-size = 1000[[graphite]]
Controls one or many listeners for Graphite data.
[[graphite]]
Determines whether the graphite endpoint is enabled.
enabled = false
database = “graphite”
retention-policy = “”
bind-address = “:2003”
protocol = “tcp”
consistency-level = “one”These next lines control how batching works. You should have this enabled
otherwise you could get dropped metrics or poor performance. Batching
will buffer points in memory if you have many coming in.Flush if this many points get buffered
batch-size = 5000number of batches that may be pending in memory
batch-pending = 10Flush at least this often even if we haven’t hit buffer limit
batch-timeout = “1s”UDP Read buffer size, 0 means OS default. UDP listener will fail if set above OS max.
udp-read-buffer = 0This string joins multiple matching ‘measurement’ values providing more control over the final measurement name.
separator = “.”Default tags that will be added to all metrics. These can be overridden at the template level
or by tags extracted from metric
tags = [“region=us-east”, “zone=1c”]Each template line requires a template pattern. It can have an optional
filter before the template and separated by spaces. It can also have optional extra
tags following the template. Multiple tags should be separated by commas and no spaces
similar to the line protocol format. There can be only one default template.
templates = [
“.app env.service.resource.measurement",
Default template
"server.”,
][collectd]
Controls one or many listeners for collectd data.
[[collectd]]
enabled = false
bind-address = “:25826”
database = “collectd”
retention-policy = “”
typesdb = “/usr/share/collectd/types.db”These next lines control how batching works. You should have this enabled
otherwise you could get dropped metrics or poor performance. Batching
will buffer points in memory if you have many coming in.Flush if this many points get buffered
batch-size = 5000Number of batches that may be pending in memory
batch-pending = 10Flush at least this often even if we haven’t hit buffer limit
batch-timeout = “10s”UDP Read buffer size, 0 means OS default. UDP listener will fail if set above OS max.
read-buffer = 0[opentsdb]
Controls one or many listeners for OpenTSDB data.
[[opentsdb]]
enabled = false
bind-address = “:4242”
database = “opentsdb”
retention-policy = “”
consistency-level = “one”
tls-enabled = false
certificate= “/etc/ssl/influxdb.pem”Log an error for every malformed point.
log-point-errors = trueThese next lines control how batching works. You should have this enabled
otherwise you could get dropped metrics or poor performance. Only points
metrics received over the telnet protocol undergo batching.Flush if this many points get buffered
batch-size = 1000Number of batches that may be pending in memory
batch-pending = 5Flush at least this often even if we haven’t hit buffer limit
batch-timeout = “1s”[[udp]]
Controls the listeners for InfluxDB line protocol data via UDP.
[[udp]]
enabled = false
bind-address = “:8089”
database = “udp”
retention-policy = “”These next lines control how batching works. You should have this enabled
otherwise you could get dropped metrics or poor performance. Batching
will buffer points in memory if you have many coming in.Flush if this many points get buffered
batch-size = 5000Number of batches that may be pending in memory
batch-pending = 10Will flush at least this often even if we haven’t hit buffer limit
batch-timeout = “1s”UDP Read buffer size, 0 means OS default. UDP listener will fail if set above OS max.
read-buffer = 0[continuous_queries]
Controls how continuous queries are run within InfluxDB.
[continuous_queries]
Determiens whether the continuous query service is enabled.
enabled = trueControls whether queries are logged when executed by the CQ service.
log-enabled = trueinterval for how often continuous queries will be checked if they need to run
run-interval = “1s”

