Your InfluxDB listens on 8086, but Grafana is on port 3000 if you didn’t change the default. 3000 is the port which the icingaweb2 module needs to connect to.
TLS/SSL is off in influxdb.
Right, forget about my suggestion with InfluxDB itself @GenBuri. You’re going to have that shifted to the Grafana server with serves the TLS endpoint. Little too much in my head atm.
Hi guys!
Back at it again…
I still have my curl error. Here it is.
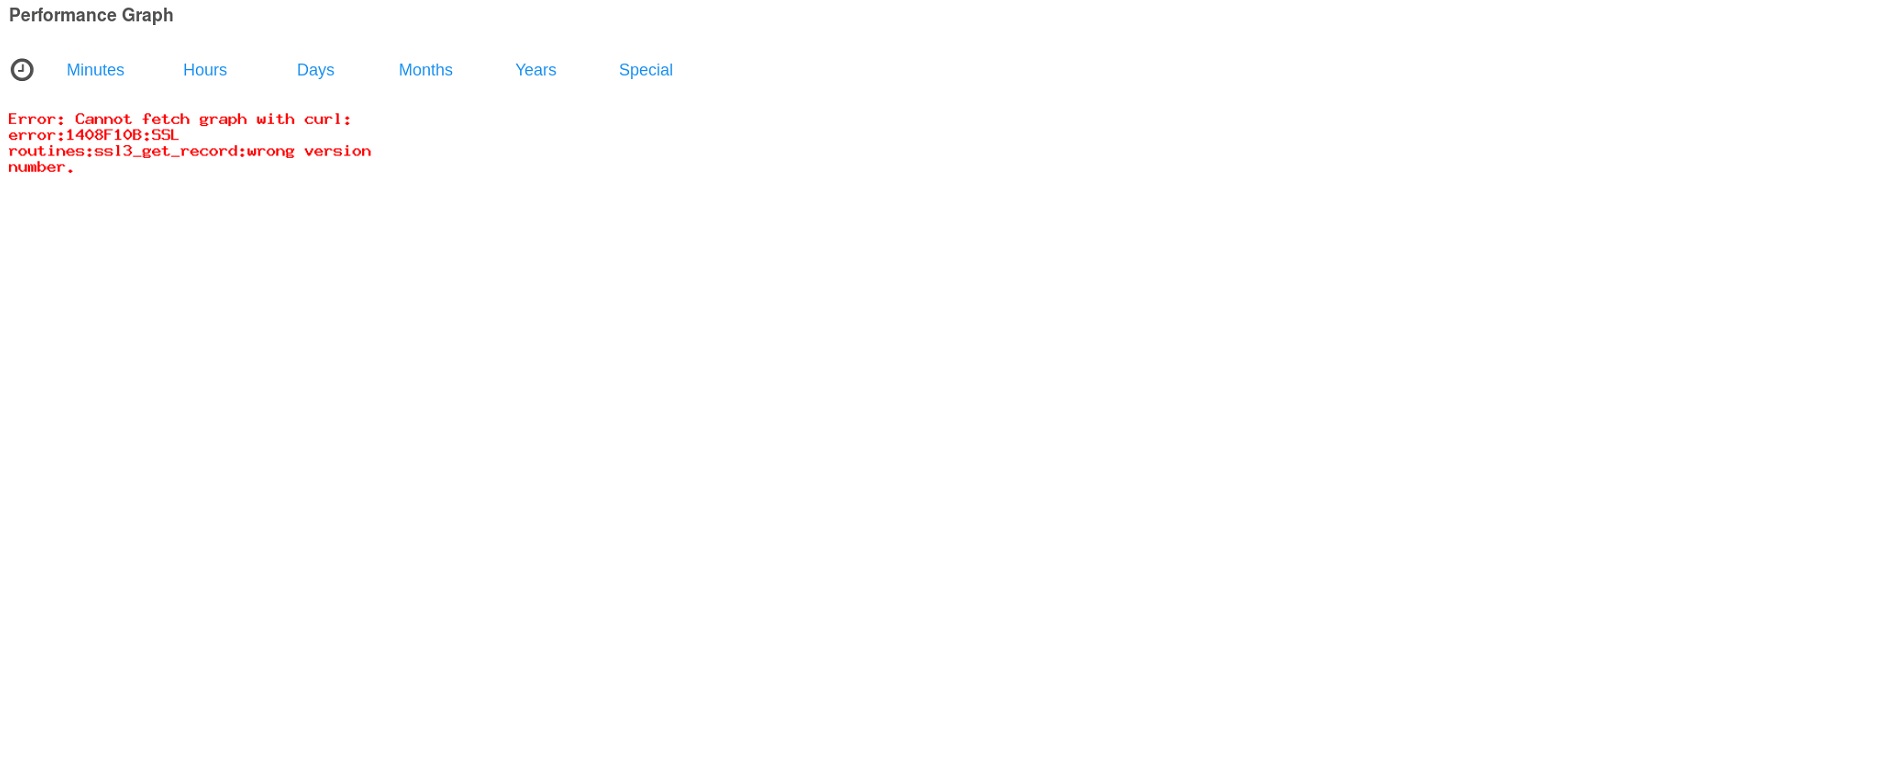
I’m wondering is it could have something to do with the perf data? I had it turned on before the holidays but our server got full really fast so we turned it off. Could it have any interaction with my issue? Also I suppose we have to enable it to gather data? Is that the data needed?
thank you !
The error says that you are using TLS but the port where you talk to, does not. Verify that in your settings that TLS on both ends is enabled.
My network guy confirmed that we don’t have TLS enabled on port 3000.
Is this something I would change in Grafana’s settings?
I’m googling for now, no luck.
Hi,
if you haven’t changed any settings in the grafana.ini configuration the default protocol http will be used. Maybe try to change in the module configuration @ Icinga Web 2 to use http instead of https for Protocol.
Greetz
Hi,
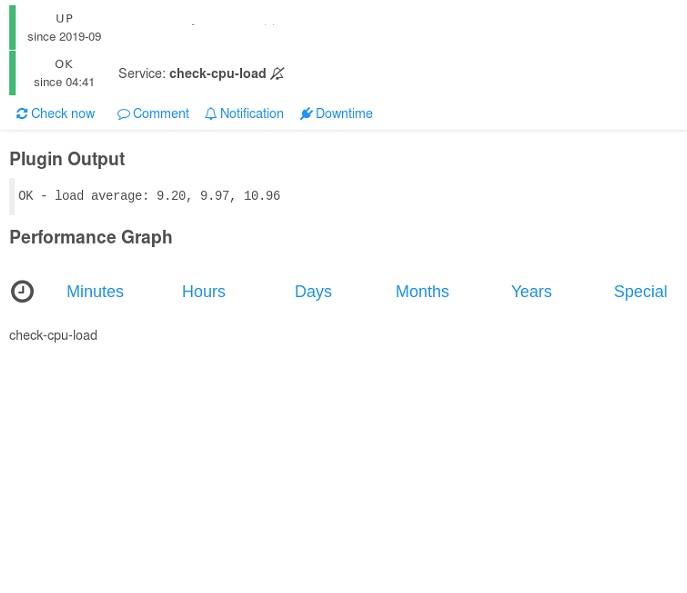
does Icinga Web 2 displays the performance data? Take a look a little further down after the graph for the headline “Performance data”. Also can you post the output of icinga2 feature list
Greetz
Hi,
Yes it does. I also thought about that and made sure I could see the perf data.
This is my feature list :
Disabled features: compatlog debuglog elasticsearch gelf graphite ido-pgsql livestatus notification opentsdb perfdata statusdata syslog
Enabled features: api checker command ido-mysql influxdb mainlog
Thank you.
Please post your grafanaini and you module configration
My grafana.ici is almost all commented except for these :
[security]
allow_embedding = true
auth.anonymous]
+enable = true
CONFIG.INI
[grafana]
version = “1”
host = “myip:3000”
protocol = “http”
timerangeAll = “1w/w”
defaultdashboard = “icinga2-default”
defaultdashboarduid = “kunjRvaZz”
defaultdashboardpanelid = “1”
defaultorgid = “1”
shadows = “0”
theme = “light”
datasource = “influxdb”
accessmode = “indirectproxy”
debug = “1”
authentication = “anon”
height = “280”
width = “640”
enableLink = “no”
indirectproxyrefresh = “yes”
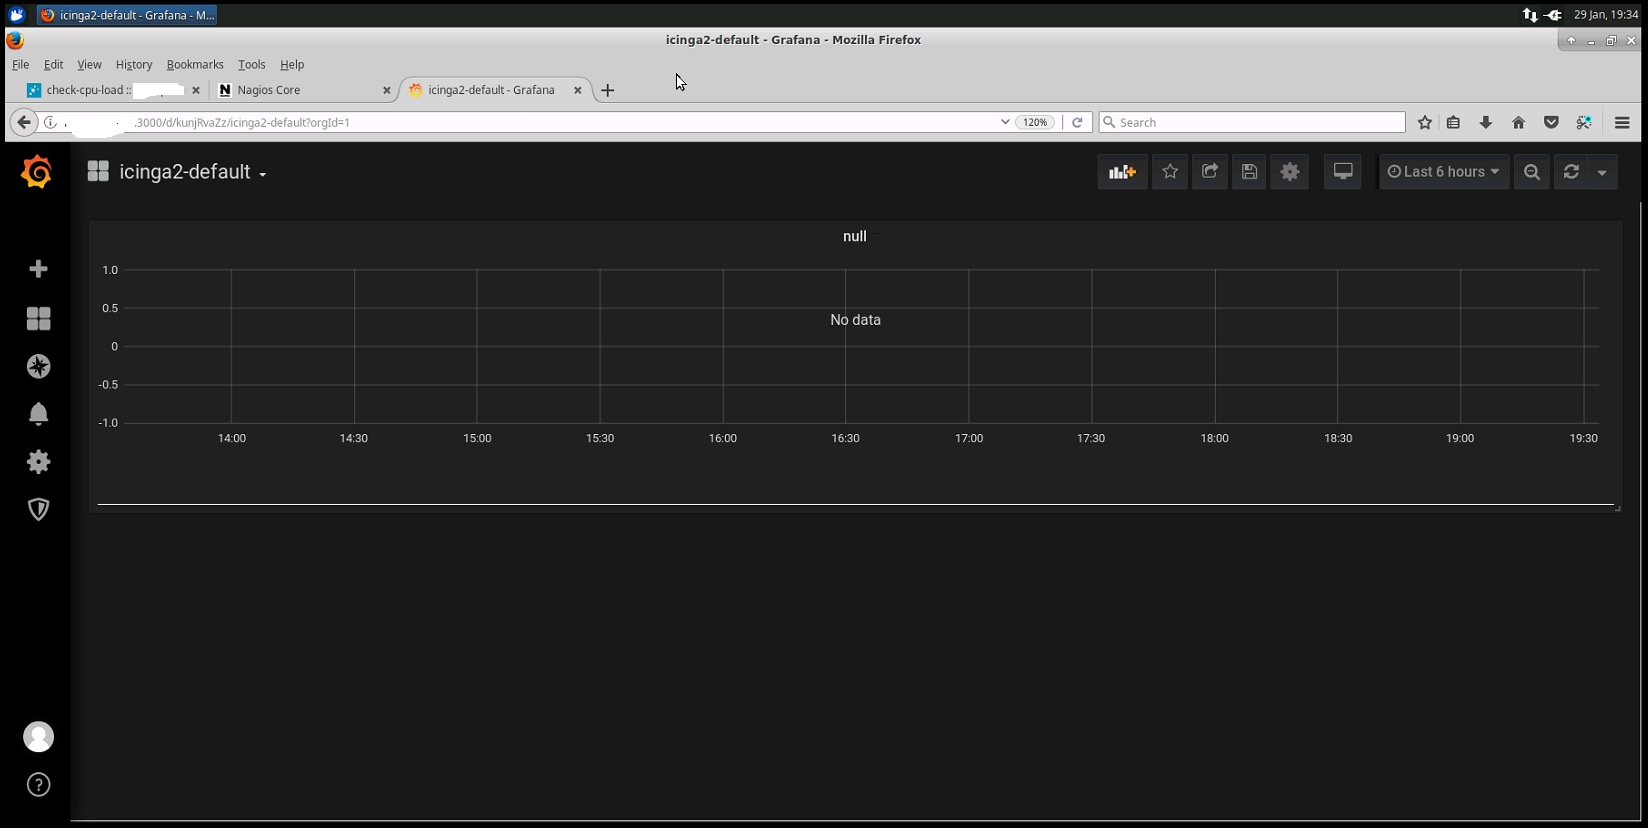
On another note…shouldn’t I be seeing some data here?
You configured anpnymous authentication, this is not enabled by default in Grafana and configure also the company for anonymous. Either enable it or even better create an API key in Grafana and use it with the module, see
If you open the dashboard in Grafana it will show noth until you set the variables in the url.
arg…I really can’t win at this thing!
I copy pasted the key in the Configuration section of the module but now I get that the key is invalid when I click on a service.
Beside creating the key and put it in the config, was there anything else to do?
tks.