Check memory in graphite does not work "Problem handling"

Hello, I have been trying for days to get the check_mem or check_memory graph and there is no way. I have downloaded several check_mem from the net and always the same: “Problem handling”.
Does anyone know how I have to do? currently I use check_memory (1.0.1) from monitoring-plugins-contrib.

My environment is:
Debian 11
Icinga Web 2 Version 2.10.1
PHP Version 7.4.28
Graphite Docker (latest): Docker Hub
graphite Module 1.1.0
icinga2 - The Icinga 2 network monitoring daemon (version: r2.13.3-1)

image

/etc/icinga2/conf.d/services.conf

apply Service "memory" {
        import "generic-service"
        check_command = "mem"
     #   vars.mem_used = true
        vars.mem_warning = "15%"
        vars.mem_critical = "10%"
  assign where host.name == NodeName
}

I’d recommend to check icinga2.log (or even debug.log) to determine if those plugins deliver mal formatted performance data (which could not be stored in your TSDB).

1 Like

Thanks @rsx , I have enabled feature debuglog:

root@coltmaster2:~# tail -f /var/log/icinga2/debug.log | grep mem

[2022-04-14 15:08:45 +0200] debug/CheckerComponent: Scheduling info for checkable 'coltmaster2.espresto.com!memory' (2022-04-14 15:08:45 +0200): Object 'coltmaster2.espresto.com!memory', Next Check: 2022-04-14 15:08:45 +0200(1.64994e+09).
[2022-04-14 15:08:45 +0200] debug/CheckerComponent: Executing check for 'coltmaster2.espresto.com!memory'
[2022-04-14 15:08:45 +0200] debug/Checkable: Update checkable 'coltmaster2.espresto.com!memory' with check interval '60' from last check time at 2022-04-14 15:07:49 +0200 (1.64994e+09) to next check time at 2022-04-14 15:09:42 +0200 (1.64994e+09).
[2022-04-14 15:08:45 +0200] notice/Process: Running command '/usr/lib/nagios/plugins/check_mem.pl' '-c' '10%' '-w' '15%': PID 1402554
[2022-04-14 15:08:45 +0200] debug/CheckerComponent: Check finished for object 'coltmaster2.espresto.com!memory'
[2022-04-14 15:08:45 +0200] notice/Process: PID 1402554 ('/usr/lib/nagios/plugins/check_mem.pl' '-c' '10%' '-w' '15%') terminated with exit code 0
[2022-04-14 15:08:45 +0200] debug/Checkable: Update checkable 'coltmaster2.espresto.com!memory' with check interval '60' from last check time at 2022-04-14 15:08:45 +0200 (1.64994e+09) to next check time at 2022-04-14 15:09:42 +0200 (1.64994e+09).
[2022-04-14 15:08:45 +0200] debug/GraphiteWriter: Checkable 'coltmaster2.espresto.com!memory' adds to metric list: 'icinga2.coltmaster2_espresto_com.services.memory.mem.perfdata.free.value 3016572928 1649941725'.
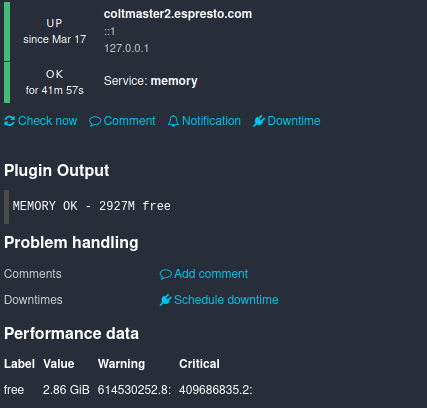
[2022-04-14 15:08:46 +0200] debug/IdoMysqlConnection: Query: UPDATE icinga_servicestatus SET acknowledgement_type = '0',  active_checks_enabled = '1',  check_command = 'mem',  check_source = 'coltmaster2.espresto.com',  check_timeperiod_object_id = NULL,  check_type = '0',  current_check_attempt = '1',  current_notification_number = '0',  current_state = '0',  endpoint_object_id = 246,  event_handler_enabled = '1',  execution_time = '0.091133',  flap_detection_enabled = '0',  has_been_checked = '1',  instance_id = 1,  is_flapping = '0',  is_reachable = '1',  last_check = FROM_UNIXTIME(1649941725),  last_hard_state = '0',  last_hard_state_change = FROM_UNIXTIME(1649936190),  last_notification = FROM_UNIXTIME(1649936190),  last_state_change = FROM_UNIXTIME(1649936190),  last_time_critical = FROM_UNIXTIME(1649936167),  last_time_ok = FROM_UNIXTIME(1649941725),  last_time_unknown = FROM_UNIXTIME(1649936105),  last_time_warning = NULL,  latency = '0.000487',  long_output = '',  max_check_attempts = '5',  next_check = FROM_UNIXTIME(1649941782),  next_notification = FROM_UNIXTIME(1649943349),  normal_check_interval = '1',  notifications_enabled = '1',  original_attributes = 'null',  output = 'MEMORY OK - 2876M free ',  passive_checks_enabled = '1',  percent_state_change = '0',  perfdata = 'free=3016572928b;614530252.8:;409686835.2:',  problem_has_been_acknowledged = '0',  process_performance_data = '1',  retry_check_interval = '0.500000',  scheduled_downtime_depth = '0',  service_object_id = 275,  should_be_scheduled = '1',  state_type = '1',  status_update_time = FROM_UNIXTIME(1649941725) WHERE service_object_id = 275

root@coltmaster2:~# tail -f /var/log/icinga2/icinga2.log | grep mem

[2022-04-14 15:06:52 +0200] information/ExternalCommandListener: Executing external command: [1649941612] SCHEDULE_FORCED_SVC_CHECK;coltmaster2.espresto.com;memory;1649941612

Any other ideas?
I can’t think of any more…
On my old Icinga server it works but it uses a check_mem with nagios-perl-plugin that no longer exists in Debian 11.

Hi.

One thing that looks strange but doesnt’t seem to make a difference to the perfdata output is the % - you can just omit it.

Here an example which works since some years.
Tested with check_mem.pl v1.0.

Please note that the name of the corresponding check command is mem

  1. The service (snippet)
Service_snippet
...
  check_command = "mem"
  vars.mem_used = true
  vars.mem_cache = true
  vars.mem_warning = 80
  vars.mem_critical = 90
...
  1. The full template for icingaweb2:
    (# path e.g. : /etc/icingaweb2/modules/graphite/templates/mem.ini)

Please make sure that there is only one matching template for this check command (here: mem).

Graphite_template_full
[mem.graph]
check_command = "mem"

[mem.metrics_filters]
mem.max = "$service_name_template$.perfdata.TOTAL.value"
mem.used = "$service_name_template$.perfdata.USED.value"
mem.caches = "$service_name_template$.perfdata.CACHES.value"
mem.free = "$service_name_template$.perfdata.FREE.value"

[mem.urlparams]
areaAlpha = "0.5"
areaMode = "first"
bgcolor = "white"
lineWidth = "2"
min = "0"
yUnitSystem = "binary"

[mem.functions]
mem.max = "alias(color($metric$, '#cfd7e6'), 'Max')"
mem.used = "alias(color($metric$, '#1a7dd7'), 'Used')"
mem.caches = "alias(color($metric$, '#ff0000'), 'Cache')"
mem.free = "alias(color($metric$, '#298a08'), 'Free')"

(The colors do not matter, I was just too lazy to change them).)


EDIT:
I just noticed, that the output of your command:
‘/usr/lib/nagios/plugins/check_mem.pl’ ‘-c’ ‘10%’ ‘-w’ ‘15%’
throws an error in version 1.0.
It complains, that either USED or FREE must be set (-u or -f).
By setting either vars.mem_used or vars.mem_free.

So maybe you should uncomment the corresponding setting and set the corresponding warn/crit values.


Greetings.

Thank you very much @homerjay !
At first I could not find the check with the -f option. I downloaded from the repositories all the moninitoring-plugins* and nagios-plugin* and nothing.
I found this one:
https://github.com/justintime/nagios-plugins/tree/master/check_mem
and then I created the same file:
/etc/icingaweb2/modules/graphite/templates/mem.ini , copied your content and edited:
/etc/icinga2/conf.d/services.conf

apply Service "memory" {
        import "generic-service"
        check_command = "mem"
        vars.mem_cache = true
        vars.mem_used = true
        vars.mem_warning = 80
        vars.mem_critical = 90
  assign where host.name == NodeName
}

I test it with stress-ng because the lines were too straight:

stress-ng --vm-bytes $(awk ‘/MemAvailable/{printf “%d\n”, $2 * 0.9;}’ < /proc/meminfo)k --vm-keep -m 1

Have a nice day! :slight_smile:

1 Like

Hi again!
I have gone back to the Icinga configuration and I have noticed that this memory check does not give me results older than 1 day…
What have I missed to do?

Hi.

Would you please open a new topic for this, if the following links do not help?

https://community.icinga.com/t/graphite-wont-graph-more-than-2-days-of-data/9220

https://community.icinga.com/t/graphite-resets-graphs-after-each-server-reboot/7646

(they contain a lot of information)


Greetings.

thanks @homerjay ,
It seems that the memory check does not have the icinga pattern in the graphite configuration.
I have edited the file:
bash-5.1# /opt/graphite/conf/storage-schemas.conf

[icinga_internals]
pattern = ^icinga\..*\.(max_check_attempts|reachable|current_attempt|execution_time|latency|state|state_type)  
retentions = 5m:7d

[icinga_default]
pattern = ^icinga\. 
retentions = 1m:2d,5m:10d,30m:90d,360m:4y 

[default]
pattern = .*
retentions = 1m:14d,5m:90d,30m:1y,120m:4y

#[default_1min_for_1day]
#pattern = .*
#retentions = 60s:1d

[carbon]
pattern = ^carbon\.
retentions = 60:90d

We will see in a few days if it works :slight_smile: