I recently installed Grafana in my icinga enviroment, i followed this tutorial: https://github.com/chrisss404/icinga2-influxdb-grafana
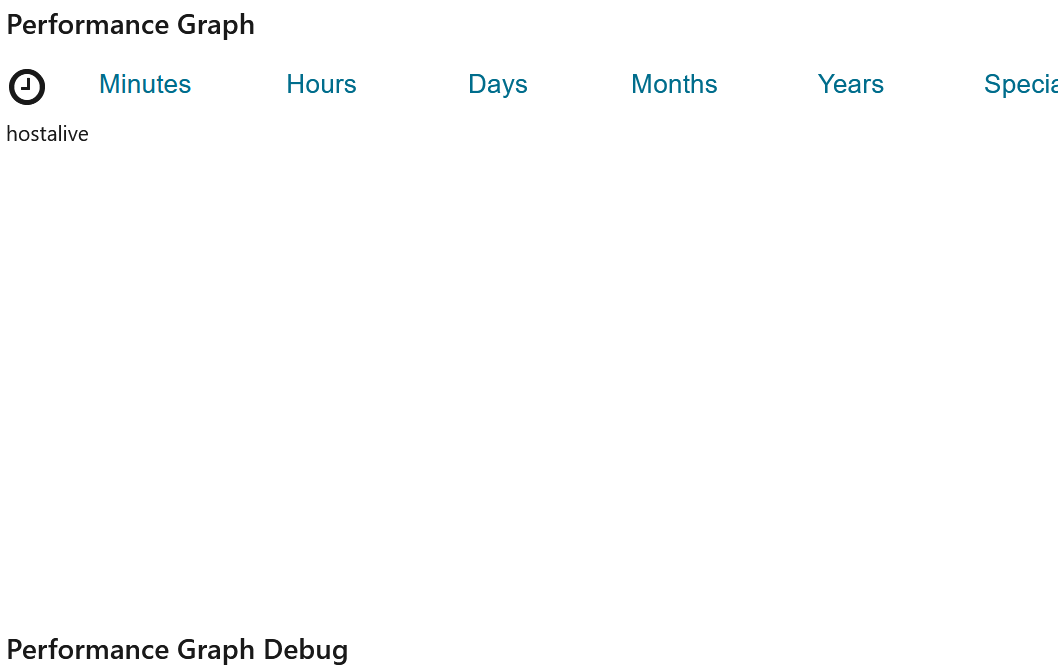
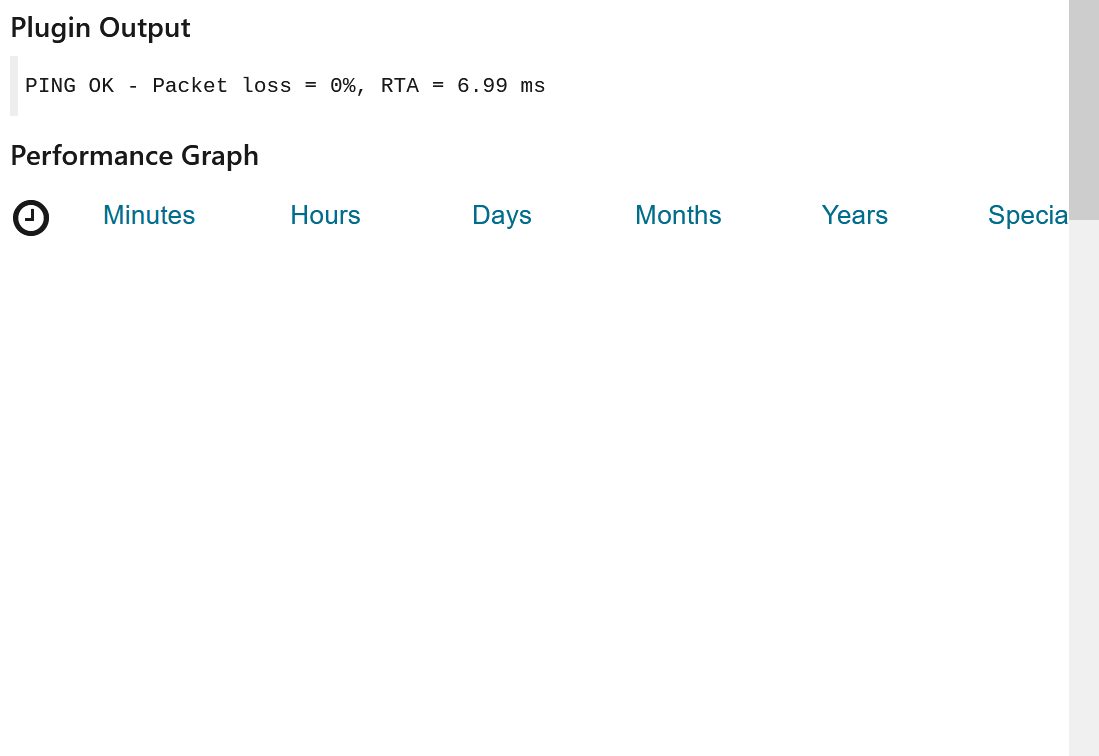
It works in grafana sides but when i try to embed it into my icingaweb it does not display graphs
I tried to enable the debug mode so i think i should be able to see the graph or at least the error message but i don’t see either of them
Even Grafana logs doesn’t signal any error, I’m very confused
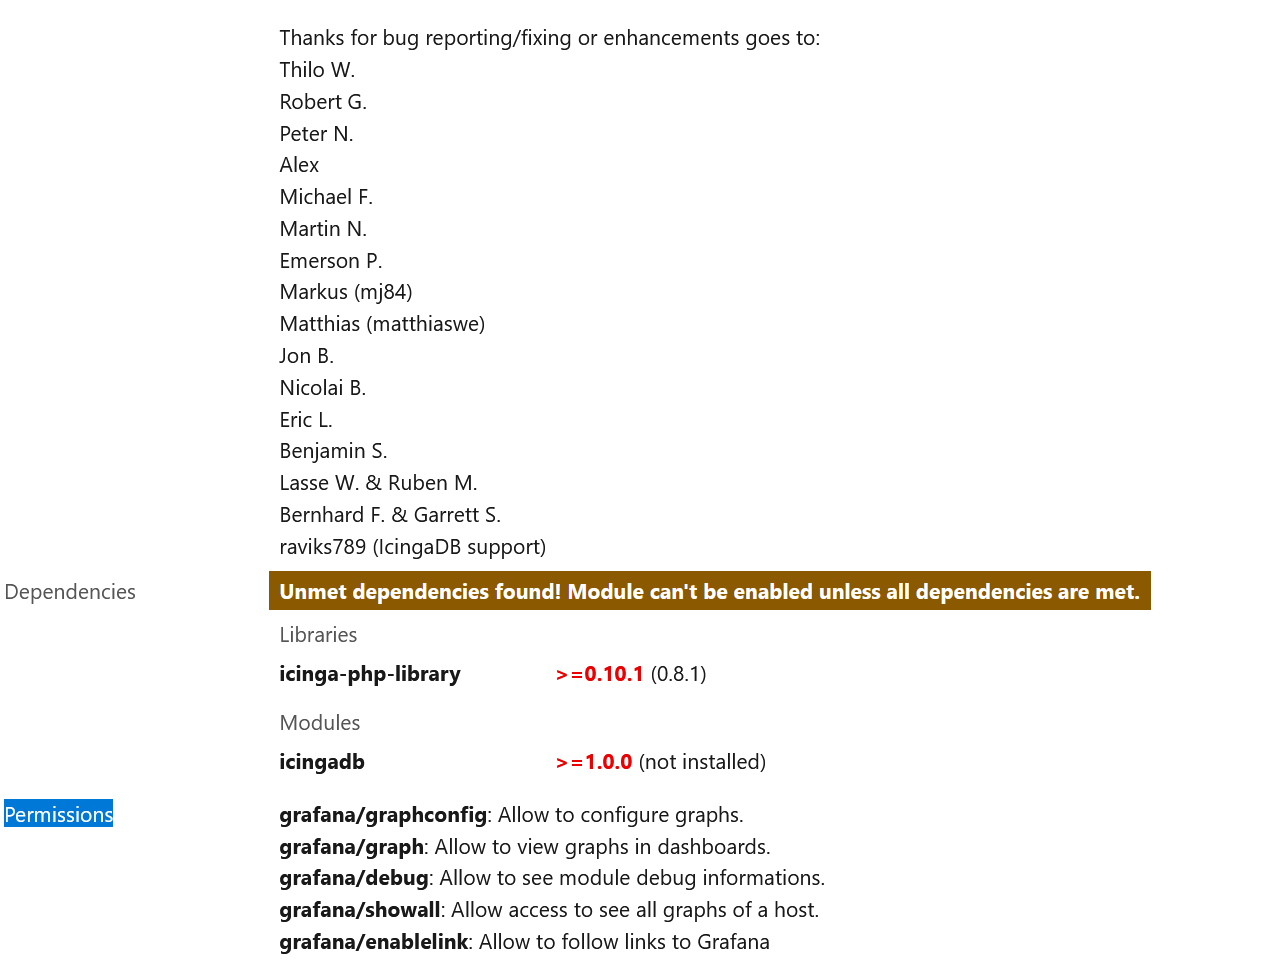
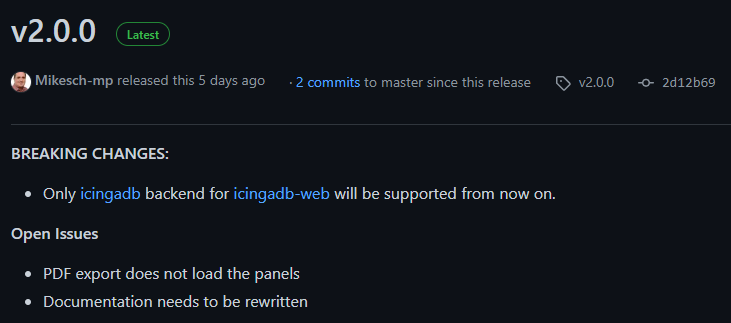
I saw this, but i don’t know how to upgrade the versions, maybe this could be a problem ( I see it’s working by now but maybe it is not?)
Ok i think i will downgrade the module at the moment, i will change later, but i can’t find any grafana module report < 2.0.0, where do i find it? Or is there a particular way to downgrade an icinga module?
Apologies for (slightly) hijacking a thread here, but I’ve been following the
guide at https://github.com/Mikesch-mp/icingaweb2-module-
grafana/blob/master/doc/02-installation.md for getting Grafana integrated with
Icinga2.
Under “Grafana Preparations” is the statement:
“Depending on which mode (proxy/indirect proxy/direct/iframe) you want to use
you have to set some configuration in Grafana.”
What’s the difference between these modes and how would I decide which one I
want to use? I have no idea why one might be better than another in any given
setup, and therefore how to choose which one I should go for.
Hello everyone,
Sorry for late reply, i still have the same problem, but it’s strange, i can’t see datas but it seems working correctly
Can someone explain me what happening? I can’t see any error message
Hi Niccolò
When you click the alternate mouse key on the graph and open the link to the graph in a separate window, you may see more.
When you use the new icingadb, you have to use the newest version of the grafana module. I will test it soon.
Regards
Matthias