Icinga for Windows environment
Icinga for Windows environment:
Environment configuration:
PowerShell Root => C:\Program Files\WindowsPowerShell\Modules
Icinga for Windows Service Path => C:\Program Files\icinga-framework-service
Icinga for Windows Service User => NT Authority\NetworkService
Icinga for Windows Service Pid => 7644
Icinga for Windows JEA Pid =>
Icinga Agent Path => C:\Program Files\ICINGA2
Icinga Agent User => NT AUTHORITY\NetworkService
Defined Default User => NT Authority\NetworkService
Icinga Managed User => False
PowerShell Version => 5.1.22621.4391
Operating System => Microsoft Windows 11 Pro
Operating System Version => 10.0.22631
JEA Context =>
JEA Session File =>
Api Check Forwarder => True
Debug Mode => False
Icinga for Windows Certificate:
Not installed
List of configured background daemons on this system:
Start-IcingaServiceCheckDaemon
No arguments defined
Start-IcingaWindowsRESTApi
No arguments defined
List of configured background service checks on this system:
=> Collect Metrics Over Time - Icinga for Windows
No background service checks configured
List of configured repositories on this system. The list order matches the apply order:
Icinga Stable
CloneSource =>
Enabled => True
LocalPath =>
Order => 0
RemotePath => https://packages.icinga.com/IcingaForWindows/stable/ifw.repo.json
UseSCP => False
Installed components on this system:
Component Version Available
agent 2.14.0 2.14.3
framework 1.11.0 1.12.3
plugins 1.11.0 1.12.0
service 1.2.0 1.2.0
On several of our most recently deployed Windows workstations, we’re seeing invoke-IcingaCheckCPU fail to execute citing a problem with the Processor Utility counter. After reviewing the framework source on Github, it looks like the Framework is what produces this output, not the plugin:
Plugin Output
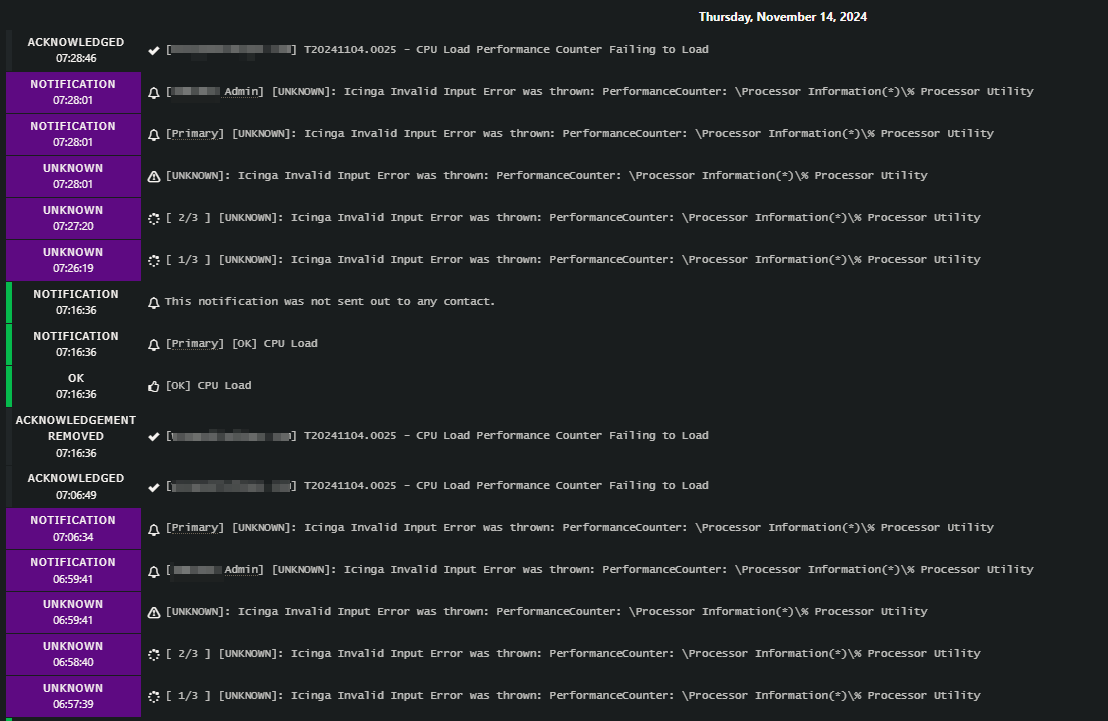
[UNKNOWN]: Icinga Invalid Input Error was thrown: PerformanceCounter: \Processor Information(*)% Processor Utility
A plugin failed to fetch Performance Counter information. Please ensure the counter is written properly and available on your system.
I have no issues querying this counter with wmic, get-CimInstance, or Performance Monitor. Only icinga2 queries fail.
The agent is running as ‘NT Authority\Network Service’.
I have been able to temporarily resolve the issue by enabling the JEA Profile. This seems to fail at random. I’ve enabled the profile on a set of 5 computers. Computer 4 was not rebooted.
5-Computer Agent Troubleshooting Details
- Comp-1 Rebooted at 4P 11/13. No issues until the user logged in at 8:50a 11/14. The next check at 8:57 returned the same errors
- Comp-2 Was rebooted at 4P 11/13. No issues until 3:15P 11/4 where it started having issues again. I don’t see a logon event during this time but I’m not sure if I’d see an unlock the same way I’d see a user login.
- Comp-3 entered this state when it was logged into the following day at 6:57a. I reapplied this change, and asked the user to reboot. ~20m later, they logged back in and the agent could no longer query it again:
- Comp-4 Has never exhibited signs of issues on this counter. I include it because it was part of the same deployed batch at the same customer with the same hardware.
- Comp-5 Is at a completely different customer. This device has never showed signs of this particular problem. It started at 1P 11/14. Restarting the agent this morning with
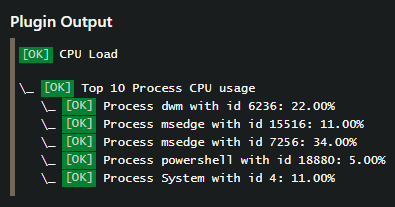
net stop icinga2andnet start icinga2allowed proper results to be returned albeit without the “top processes” information:
Normal Results:

Comp-5 result:

No Windows updates were running at the time on any of these devices. Running Windows updates did not improve the matter.
Per Comp-3, rebooting does not seem to resolve the issue permanently.
Until given a different idea, I’m pivoting to see if this has something to do with the user logins/idling. I have a sneaking suspicion this has something to do with Modern Standby. I’m seeing the issue on a few Lenovo and Surface notebooks as well.

