Hi all,
I don’t know since when this happens, but I have strange measurements in our Icinga2 InfluxDB and cannot find out, where this is coming from.
OS: Ubuntu 18.04.4 LTS
Influx: 1.8.4-1
Icinga2: r2.12.3-1 / 2 Masters
Config:
object InfluxdbWriter "influxdb" {
  host = "1.2.3.4"
  port = 8086
  database = "icinga2"
  password = "xxx"
  flush_threshold = 4096
  flush_interval = 60s
  enable_send_thresholds = true
  enable_send_metadata = true
  enable_ha = true
  host_template = {
    measurement = "$host.check_command$"
    tags = {
      hostname = "$host.name$"
    }
  }
  service_template = {
    measurement = "$service.check_command$"
    tags = {
      hostname = "$host.name$"
      service = "$service.name$"
    }
  }
}
Beside my correct measurements, I have sth. like this:
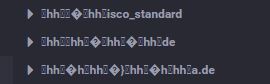
Problem here, all my “Cleanup” Scripts don’t work anymore and I have absolutely no idea, where these strange measurements are coming from.
Cheers,
Marcus