Vspheredb Server Add page is blank

Hello

I am facing a typical issue.

I have just installed the vpsheredb


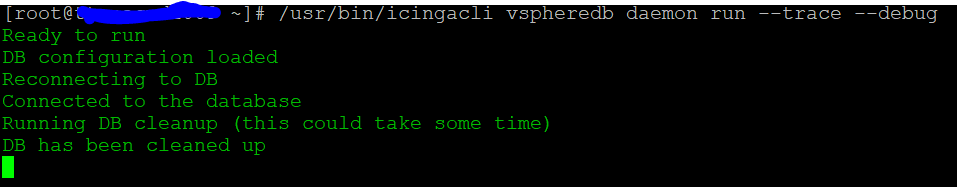
I am also running icinga-vspheredb.service - Icinga vSphereDB Daemon

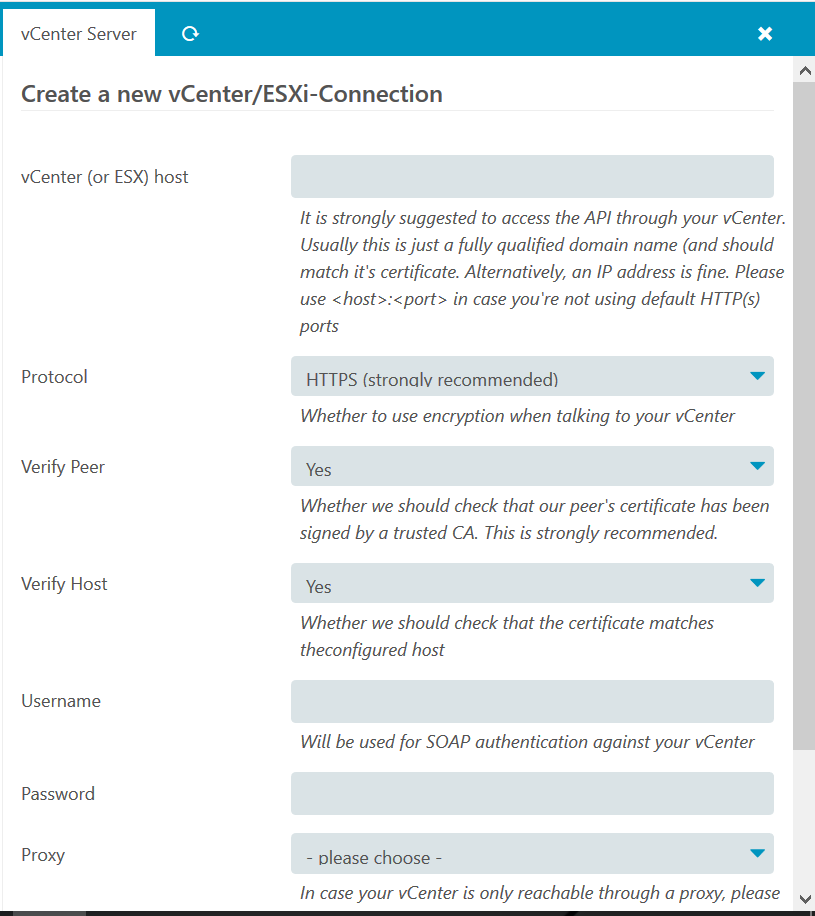
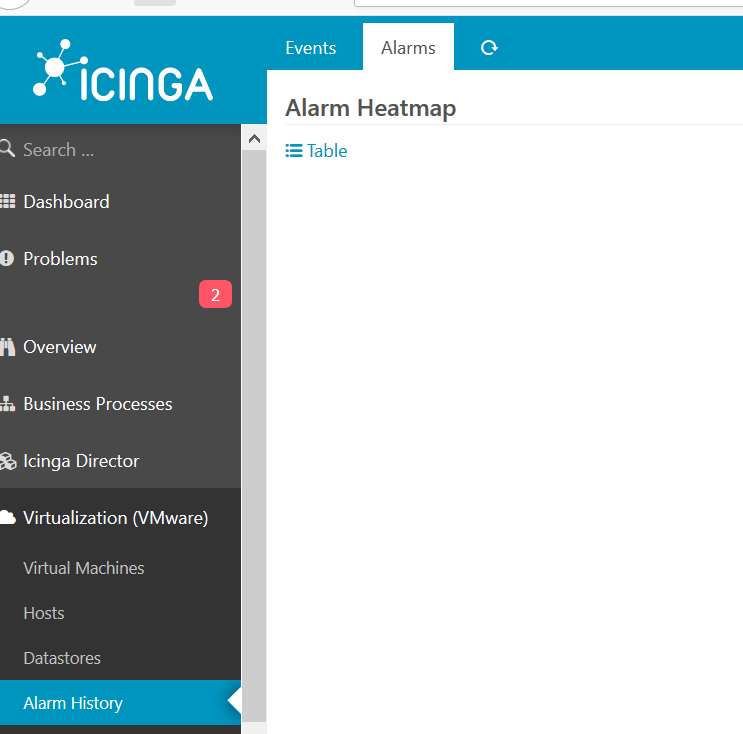
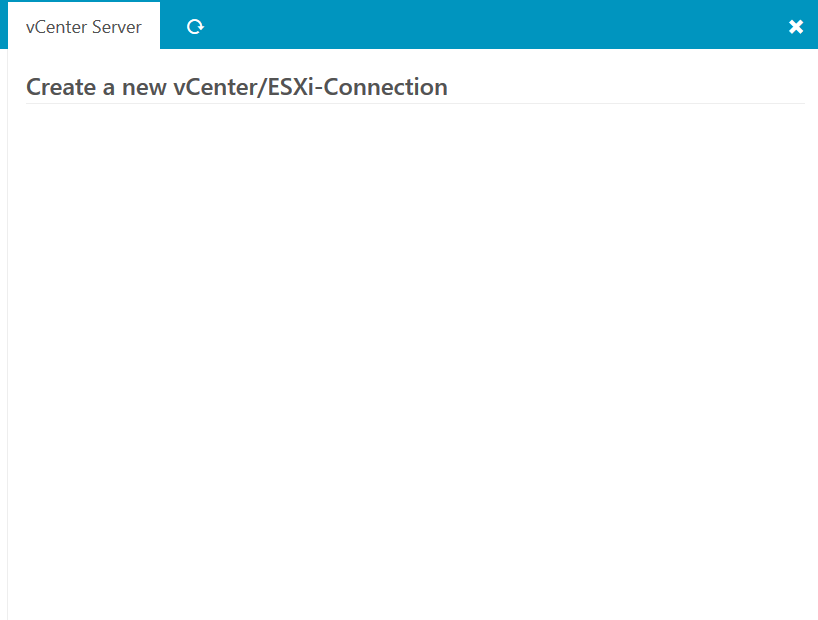
But when I click on Virtualization -> Servers -> vCenter Server -> Add
The right hand window -> Create a new VCenter/ESXi -Connection is completely blank

My Modules (/usr/share/icingaweb2/modules)directory permission looks OK

Not sure what am I missing :frowning:

Hi,

  • are you logged in as admin (icingaweb)?
  • Right permissions in your resources.ini?
  • utf8mb4?

You can try to debug the daemon:

> # /usr/bin/icingacli vspheredb daemon run --trace --debug

1 Like

Yes I am logged in as admin


image
Yes the DB was created using “create database vspheredb CHARACTER SET ‘utf8mb4’ COLLATE utf8mb4_bin;”

Not sure if there is any other log which I can check. Really I am in soup and have no clue how to move forward. I need this very bad

Ridiculous option, but try relogin in icingaweb2 or kill your browser cache.

:crazy_face: I already tried logging different browser.

This was the best option to showcase icinga2 greatness against like of blue___dora. Sad it is not working. Do you think it is a bug ?

What’s your Webserver log saying while you are viewing this page?

Nothing.

–>/var/log/httpd/error.log

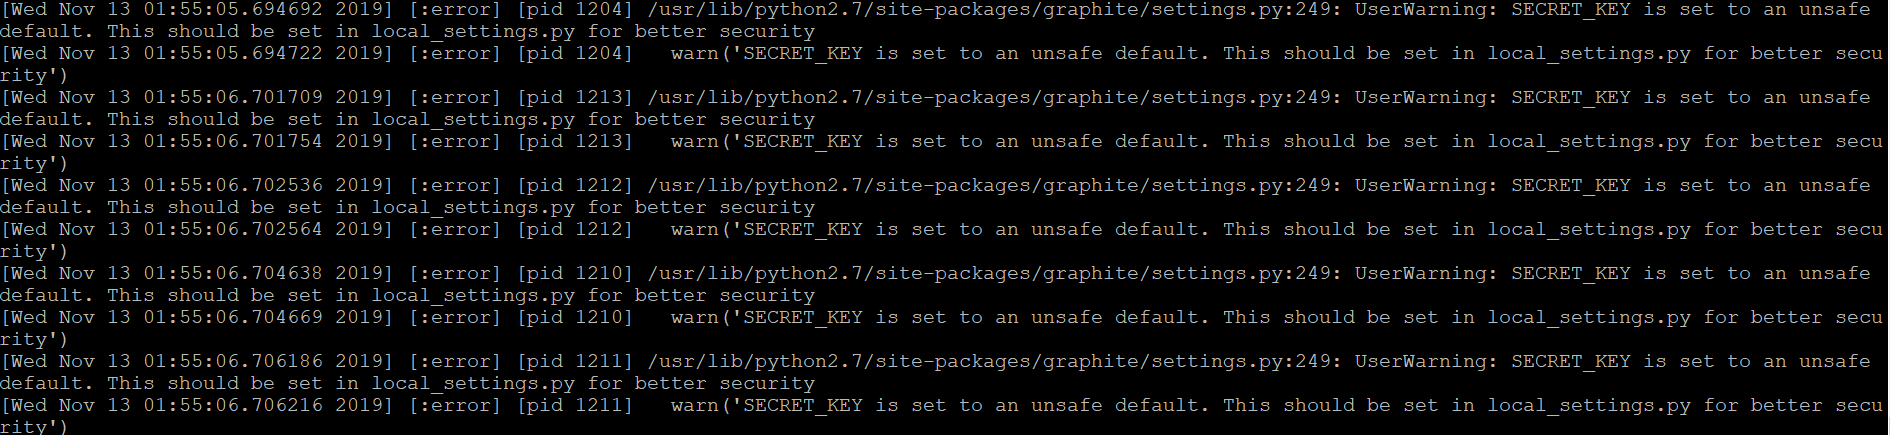
When I click on the Add and the right side it goes blank - this log doesn’t rotate. Any other log you want me to check

My /var/log/httpd/access_log is not updating :frowning: but everything is working ok in terms of icingaweb2 apart from vSphere

EDIT: I bumped into the issue as mentioned here. I can see the issue was solved. But I am not able to understand what was done to fix it. Can anyone please guide. I am very novice in icinga2
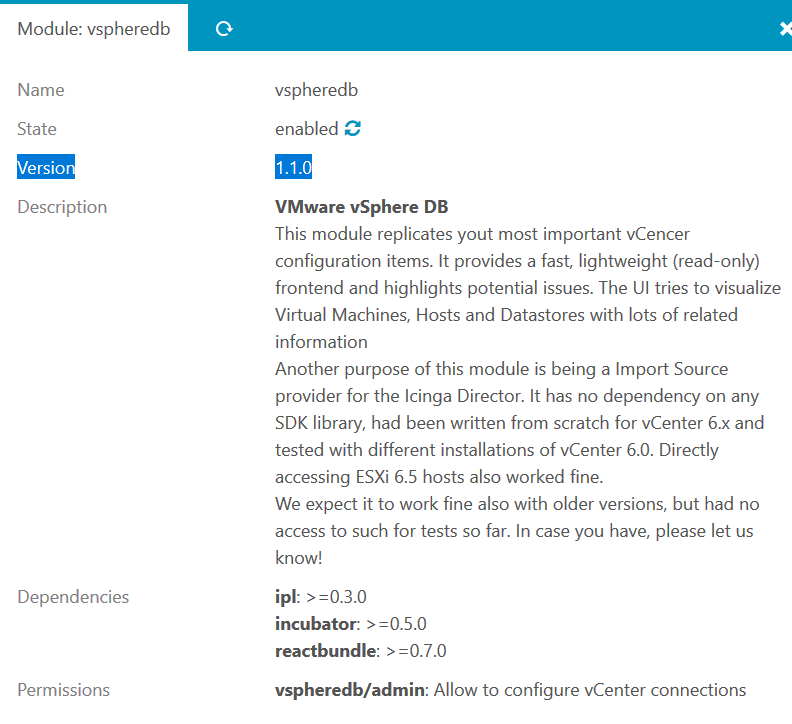
Which operating system do you use?

Please check all requirements:

Requirements
Icinga Web 2 (>= 2.5)
PHP (>= 5.6, preferably 7.x)
php-soap
php-pcntl (might already be built into your PHP binary)
php-posix (on RHEL/CentOS this is php-process, or rh-php7x-php-process)
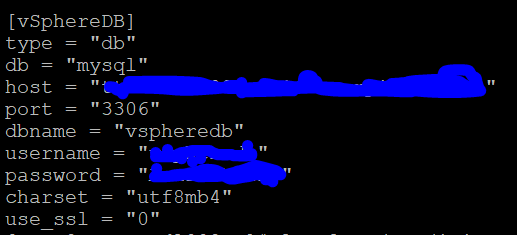
MySQL (>= 5.6) or MariaDB (>= 5.5.3)
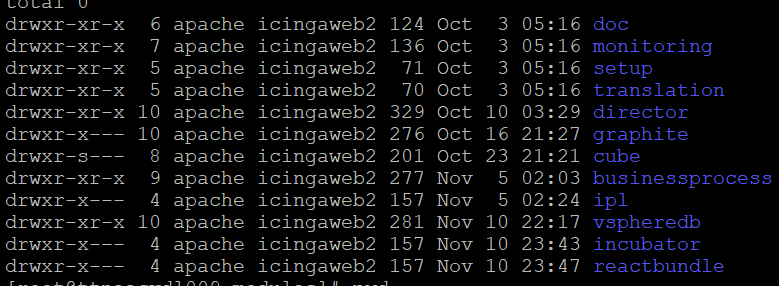
The following Icinga modules must be installed and enabled:
ipl (>=0.3.0)
incubator (>=0.5.0)
reactbundle (>=0.7.0)

Do you use apache?
Try to restart your apache service:

# systemctl restart apache(2).service

1 Like

$ /opt/rh/rh-php71/root/bin/php -i | grep pcntl
pcntl
pcntl support => enabled
$ /opt/rh/rh-php71/root/bin/php -v
PHP 7.1.30 (cli) (built: Aug 21 2019 09:27:22) ( NTS )
Copyright © 1997-2018 The PHP Group
Zend Engine v3.1.0, Copyright © 1998-2018 Zend Technologies

$ /opt/rh/rh-php71/root/bin/php -i | grep posix
/etc/opt/rh/rh-php71/php.d/20-posix.ini,
posix

Damn!! the soap is missing it seems

$/opt/rh/rh-php71/root/bin/php -i | grep soap
$

Looks like the default one has it
$ php -i | grep soap
/etc/php.d/20-soap.ini,
soap
soap.wsdl_cache => 1 => 1
soap.wsdl_cache_dir => /tmp => /tmp
soap.wsdl_cache_enabled => 1 => 1
soap.wsdl_cache_limit => 5 => 5
soap.wsdl_cache_ttl => 86400 => 86400

Which default one?

Try to fulfill all requirements and try it again :slight_smile:
Check your icinga-vspheredb.service and its output.

There are two php
I am on RHEL 7
The soap was not there in rh-php71
So installed ->

yum localinstall http://mirror.centos.org/centos/7/sclo/x86_64/rh/rh-php71/rh-php71-php-process-7.1.30-1.el7.x86_64.rpm
yum localinstall http://mirror.centos.org/centos/7/sclo/x86_64/rh/rh-php71/rh-php71-php-soap-7.1.30-1.el7.x86_64.rpm

Perfect! :partying_face:

Please mark it as solution and have fun with the plugin :slight_smile:

1 Like

Hello Guys

Sorry I am back with vpsheredb issue. I didn’t realize but later observed that my alarm history and Event history looks blank

For event history I am not sure if something is there hidden in the jungle of calendar? But apparently it looks blank apart from just calendar.


If you see closely the node has a warning symbol. Where Do I get to see the actual alarm on it?

Also will it correspond to a Icinga2 alert like other Service or host down alerts in icinga2

Rest of the tabs looks great and having data.

In your vCenter

No! Your Icinga Notification has no relation to the vsphere-plugin.

The plugin get the information directly from the connected vcenter.

Is there an alert history in your vCenter?

so i’m getting the same thing as above, but i’ve checked everything and seems to be running ok… what else can i look at to troubleshoot the blank screen?

The VCenter has alert history enabled. But not sure why not showing in icinga