Upgrading icinga2

Hello everyone,

I have a working icinga monitoring system with

icinga 2
Icinga web 2
icinga director

I have to upgrade the entire system to assure compliance between the actual master and a new master I created. Unluckly I read that in the newest versions some big changes happened such as the change of the DB from IDO Db to IcingaDB so I really need to upgrade my system

Can someone explain me how to upgrade everything without loosing data?
I saw there are not baskets for hosts, services and commands but only for groups so I think that the best practice is not to save the backup of the db, erase icinga and reinstall the newest version

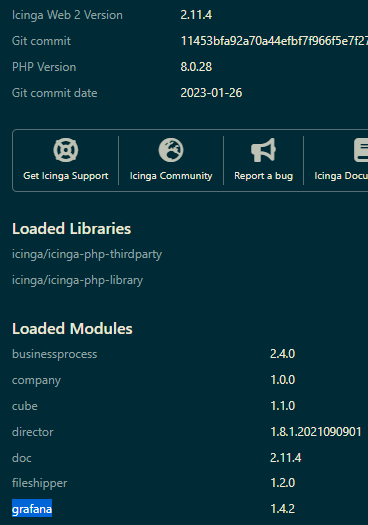
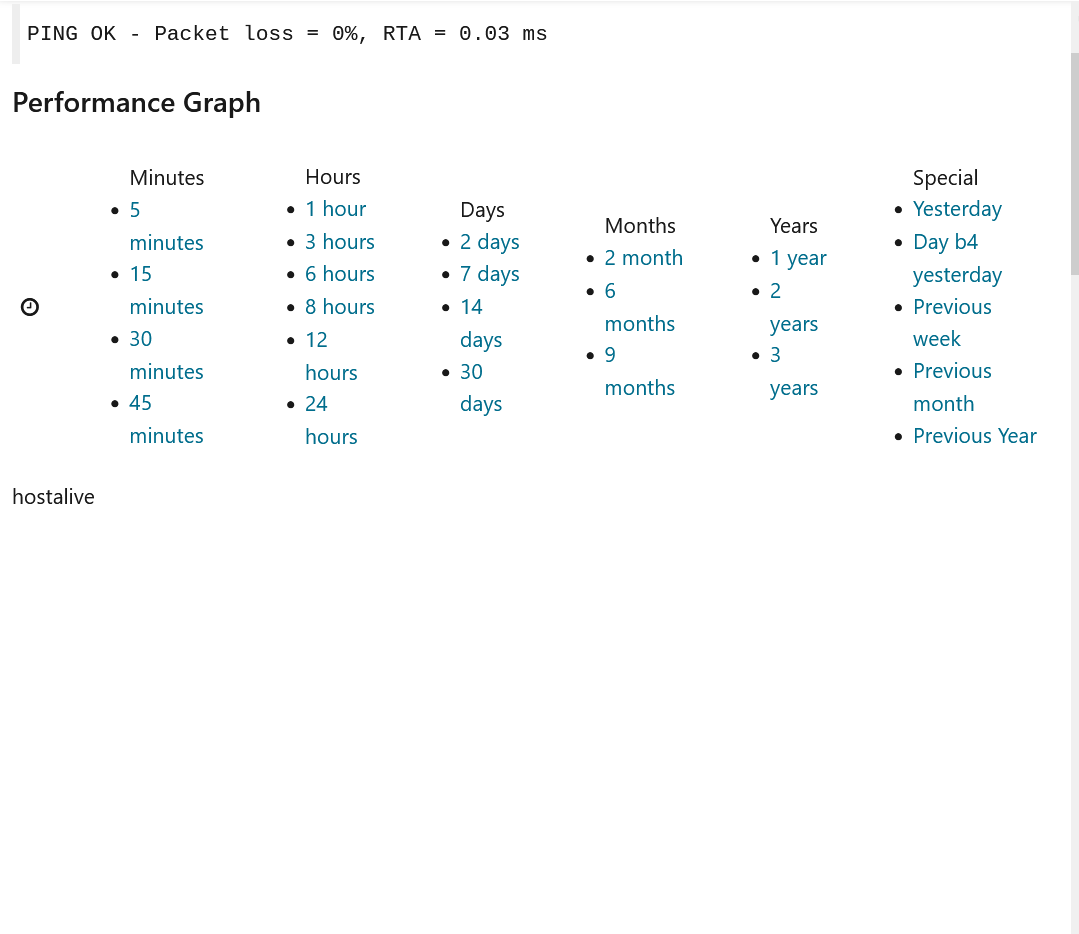
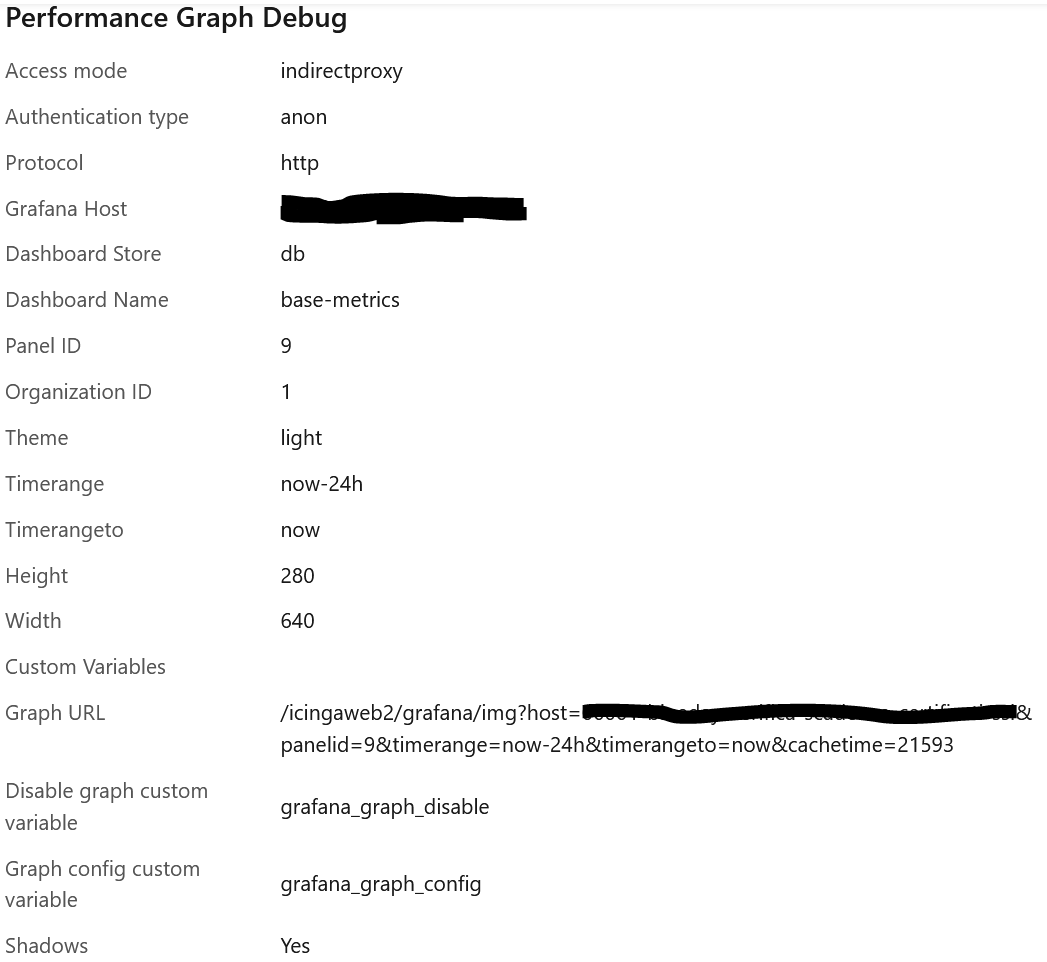
I will need also to embed grafana graphs in a second time

Hoping in a reply
Best regards

Niccolò

IDO is still supported and you can move to IcingaDB in a second step.

So I can dump the existing db and then restore it in the new server, right?

Another question is, will grafana be usable for the new version of icingaweb?

Niccolò

Yes, you can move the IDO but beware schema updates.

I think the current version of the Icingaweb2 Grafana widget requires IcingaDB so until you switched to IcingaDB you need the older release. I have it working with IDO and the current Icingaweb2.

Can you explain me how embed grafana using IDO? That would be the best practice in my case of use

Thank you,

Niccolò

I have 2 master nodes with Icingaweb2 with grafana module and Grafana installed and InfluxDB installed on a separate host.

The difference between IDO and IcingaDB is that the icingaweb2 grafana module widget needs to show up in the icingaweb2 monitoring module for IDO and in icingaweb2 icingadb-web module for IcingaDB.

Ok my case is very similar to yours, so i guess i did something wrong during the setup of grafana module.

Thank you, i will write as soon as possible to let you know if its working

Niccolò

Hello,

I installed the icingaweb grafana module and this is the situation

and these are the configurations

dont understand why it is not rendering the graph

If i click on the graph i get the correct graph ( after login )

I leverage the following Ansible roles for my setup:

Even if you don’t use Ansible, it’s quite readable and could help find a possible missing peace.

Ok thank you so much, i never used ansible but I will study it and try to fix the problem

Niccolò