It sounds like in order to do this I need to use the auto repeating panels? If that is the case, I don’t see a clear layout of what I need to do here. I read your doc and see it mentioned but not in much detail and the grafana documentation for templating exists but I don’t see how it ties together with icinga2 and the module…
Overall I guess I am just a little confused as to how I create the graphs and dashboard correctly to show up in the rights places in icingaweb2. I would really like to have all my hosts and services auto graph but I don’t know if that is even possible.
I think I see how it is working somewhat now based on the basic-metrics dashboard I imported. I am still pretty confused in how I tie things to the proper places… for example, it is showing the ping4 graph for everything… because I selected panel 1 I assume… but how can I get it to show the proper service?
Thanks. I think I understand now… use the provided dashboard that includes the templating with variables for hosts and services… configure the module to use that dashboard…create a graph for each service you use in Icinga2 and link it to the panel ID of the graph in the dashboard.
If I understand that correctly then now I just need to create graphs for all these services… would be really difficult if you have a lot I guess.
If I create a graph for a service like check_cpu, and 5 hosts have that service tied to them with a service set… will they all display the exact same graph or will the templating kick in and display the graphing for each host individually?
you can create graph configuration for service names, command names (mostly used) or services names with params (example “Diskdrive D:”, “D:” would be param.
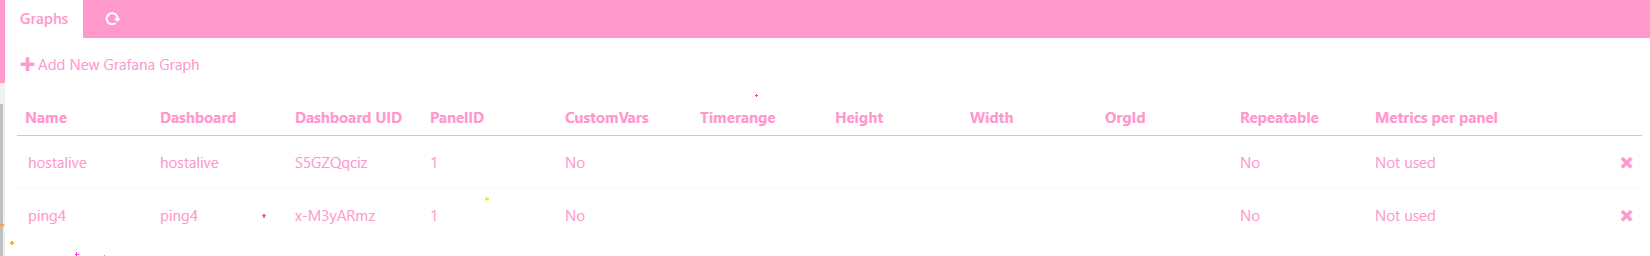
If you use command names, every service that uses that commadn will use the dashboard that you put in in the graph configuration. See my picture for an example.