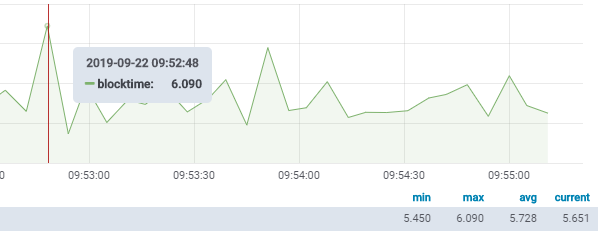
I’m using a script that uses the api to ‘push’ a measurement( x sec) to a passive service.
Every measurement belongs to a participant/name. The graph will look like this:
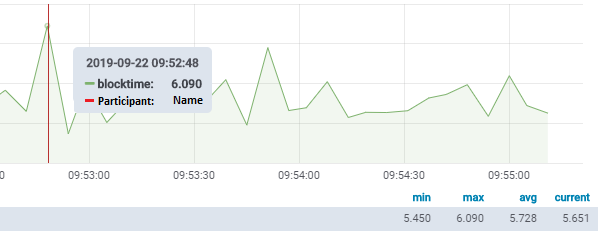
Is it possible that a tooltip is also showing a non measurable value like this ? :
I think this is not possible. At least not with Grafana and Graphite.
Things you could do instead:
put the extra info into the service name
create additional metrics per participant as part of the perf data
The performance data could look as follows: blocktime_total: 102.00, participant_a: 34.00, participant_b: 40.00, participant_c: 28.00
In this case blocktime_total is the sum of all blocktimes and will also be part of the check output.
As soon as you have the name / info you want available as part of the service name or metric it’s up to you to use different features of grafana like substring replacement on the alias, regex applied on the alias or the override settings for the dashboard.
In the end it highly depends on your use-case how applicable the different solutions are. Feel free to share more details and we might find a solution that fits.
What is your backend DB? InfluxDB? (Currently I don’t have experiences with other DBs or frontends like Graphite).
With InfluxDB it is possible to add tags to each measurement, so each metric will contain these specific tags. A mandatory tag is the hostname or servicename, but you can add additional tags in the influxdb feature config file from Icinga2 (i.e. custom variables from host/service).
Grafana can group and/or filter based on these tags.
Thanks guys @a1mw@winem will give you some more details as I find it hard to understand the answers
I’m using icinga - influxDB - grafana
It’s about a blockchain project where I want to monitor the times between blocks (succeeded in that using passive service and pushing performance data using api) and it would be nice to have the blocknumber and the name of the block proposer on the graph.
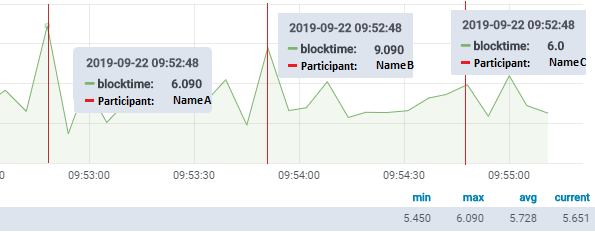
If I understand Manfred correctly those tags are not dynamic and not attached to the measurement that is sent to the passive service on that specific moment, see above image with different names and measurements.
@Marcel, if I understand your explanation correctly it’s also a possibility but will result in the same question I think .That way I’d be tracking all participants and their blocktime, but it still doesnt show the proposer of the block or the blocknumber.
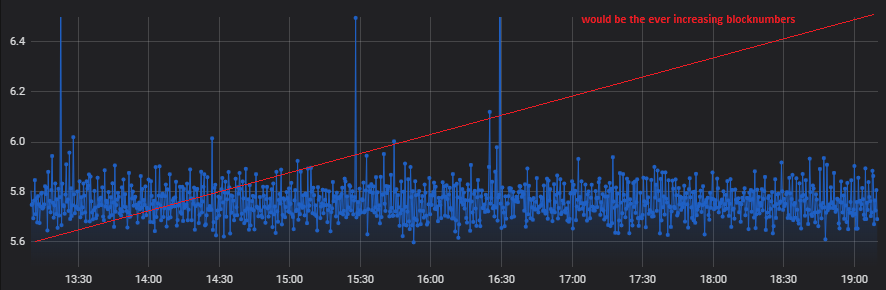
While writing and reading your suggestions I think it wouldnt be a problem to add the blocknumber as it’s something that can be measured right? It probably would look something like this:
OK, if I understood it right, the participant is not a tag, it’s an additional metric. There would be the metrics blocktime and participant in the measurement, mayby some other values are also worth to store. (my suggestion is to read the design guidlines from InfluxDb, be aware of DB growth and cardinality).
If you want to fill these values into InfluxDB, they have to be performance data within Icinga2.
Further tags needed for filtering/grouping etc. will come from custom vars per host or service.
Did you try to ask within InfluxDB or Grafana forums, probably there are more experienced people with such things? Icinga2 only pushes the desired values into DB…
The challenge here is the visualisation, IMHO this type of graph is not able to display string values.
Maybe there is way to group the graph by the second metric participant, but then you get multiple
graphs - even when they never overlap through chaining - each participant is listed in the legend.
String values usualy shown in tables or single stat panels.