We are using check_nt for service monitoring of Windows servers. Is there a way to get the top 5 contributors of CPU, Memory & Disk of windows servers in the alert details.
Not directly but you could configure the top3 checks from Linuxfabrik monitoring-plugins in your NSClient but why not use the icinga2 agent directly?
The Linuxfabrik started to remove the top3 checks by merging the top3 output into the regular checks.
Is there any suitable plugins for that?
Sure, this is the output of the 3 plugins:
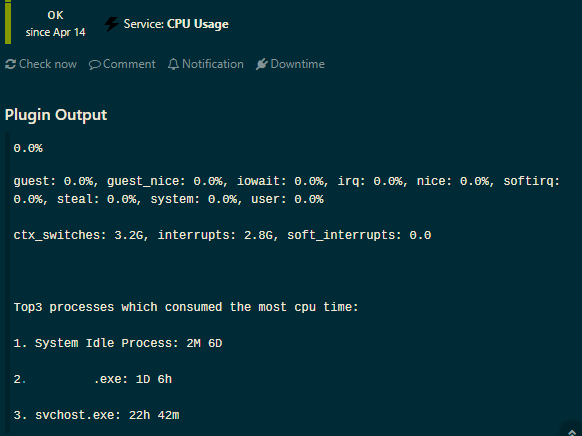
cpu-usage
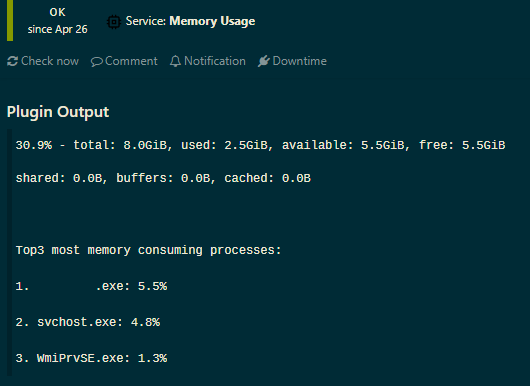
memory-usage
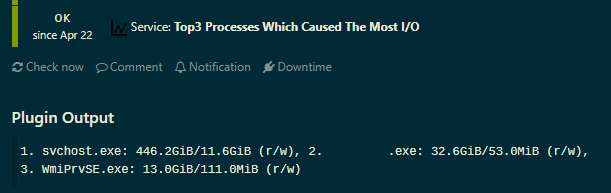
top3-processes-which-caused-the-most-io
get them from here
Great. This is what we are looking for. Which plugin you are using for enable the monitoring of these? Please share the service-check definition too.
@prajithvs I use the Icinga2 agent to run them but I see no reason why they wont work with NSClient. Sadly I can’t help you with the configuration any more then this as I don’t use the NSClient but have a look in the icingaweb2-module-director folders.
There you will find the check and service definitions in the .json file of each check - for example memory-usage.json . This will get you at least started with your adaptation for the NSClient. If you need more help, maybe request a config for NClient by opening a issue in the repository.