if you don’t see anything in the logs, you could debug this on the network layer. What does traceroute, ping (rta/pl etc.) say, while this happens? Are there packet losts? Is maybe a firewall in the middle which may could block or drop packets?
I’m not sure it’s network-related. I did a traceroute when it was happening to me and saw nothing out of the ordinary. There are no firewalls that would impact traffic flow. We are running nagios on this same vlan and I’m certain rules are applied correctly.
Changing browsers does seem to help which makes me think it’s most likely software.
Are these errors logged anywhere in icinga? I could look for surrounding events if so but I can’t seem to find anything.
Hi,
it was just an idea, because you wrote in your first post:
if diffrent browsers have diffrent behavior, you could look into the debugging tools from them. I’m not a web developer so I haven’t much experience with them. But sometimes it helped to look into it and to see the loading time or if something is blocked or loaded with errors.
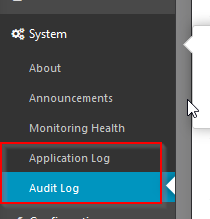
In the GUI you’ll find following menue entries
But I still don’t know if such errors are logged here. At least I wouldn’t have noticed this.
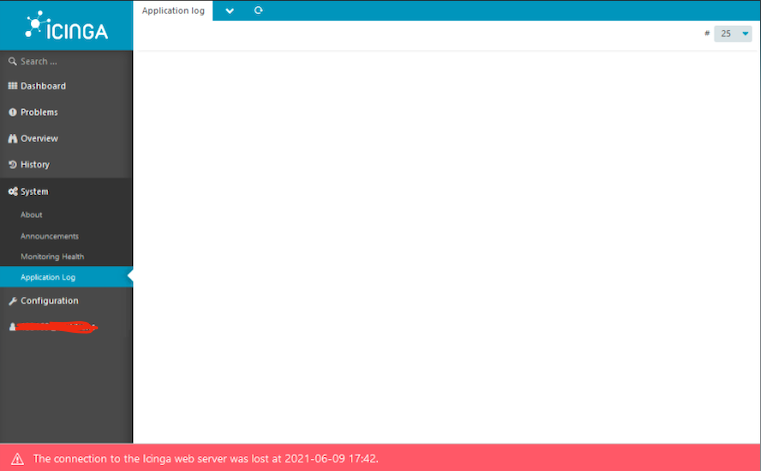
wondering if there was any resolution to this? I have a new build and getting this same error flash, then disappear on the screen. I do not have the Audit Log and the Application Log is empty in the UI