Hello Colleagues,
i currently missing a “sum” Feature and wanted to ask if you have a workaround for it.
I monitoring a Fileserver with multiple shares on it.
For each share i get a “state” like 0 for okay, 1 for warning and 3 for critical.
And because it look more than ugly to have 15 green singlestat-panels for one server on the dashboard, I try to get all this shares into one Singestat.
When one of this shares are no more working the average of all shares will no more “0” and the Singestat will be no more green.
Have you a idea how i can solve this?
I have setup a variable with all shares i want to sum. Now i can choose one share via dropdown and the Singestat is working or i choose “all” and the singestat gives me a “multiple Series Error”.
Singlestat means only 1 Value not many. So you have to write a query with outputr of one number.
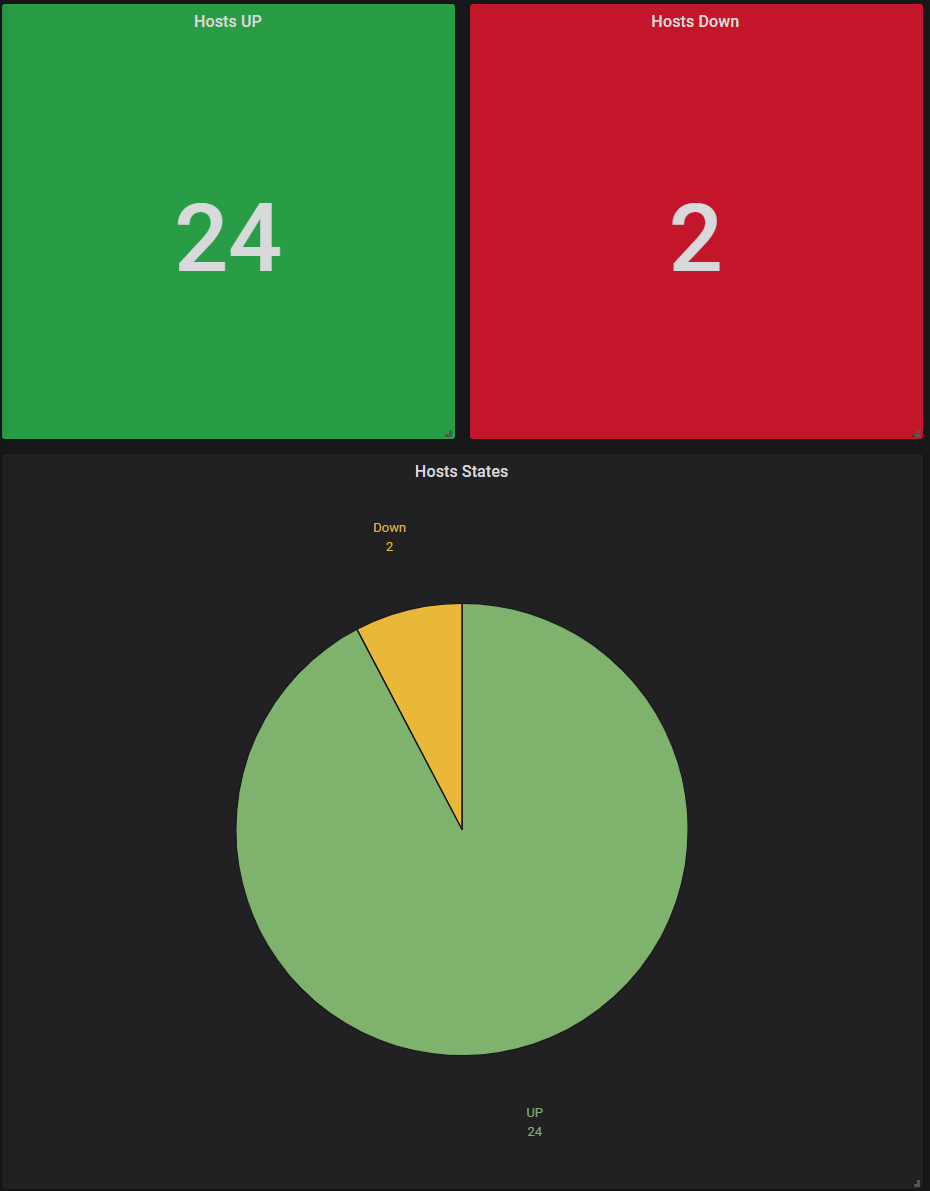
Here is an example query to sum up all hosts that are “UP”
SELECT count(hosts) as "Hosts UP" FROM (SELECT last("state") as hosts FROM "hostalive" WHERE ("hostname" =~ /.*/) GROUP BY "hostname" fill(none)) WHERE "hosts" = 0
Explanation:
inner part: This select just queries the last state of all hosts (you can filter them by using regex), grouping them by hostname and put the outcome into the variable hosts.
SELECT last("state") as hosts FROM "hostalive" WHERE ("hostname" =~ /.*/) GROUP BY "hostname" fill(none)
outer part, counts all “hosts” (the variable from the inner part) with the state of 0 (UP)
SELECT count(hosts) as "Hosts UP" FROM (INNER PART) WHERE "hosts" = 0
you can copy that query with state = 1 for down hosts or if you use service you can do that for ok,warning,critical and unkown.
For your problem, just remove the WHERE "hosts" ... part and use sum(hosts).
This is not worling inb my environment.
I get a unexpected (.
I playing around with:
SELECT last(“state”) as hosts INTO tmp_state FROM “hostalive” WHERE (“hostname” =~ /decae*/) GROUP BY “hostname” fill(none);
SELECT count(hosts) as “Hosts UP” FROM tmp_state WHERE “hosts” = 0
This SELECT Statement in one Line didn’t work for me.
I get a “unexpected (”.
Currently the Statement with “INTO” works for me.
I have to chenge some things.
I keep you updated.