SSH works on target server but Icinga shows it as CRITICAL

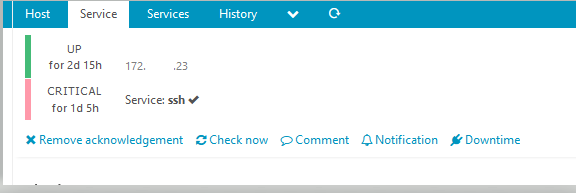
I can SSH to the target server with no issues but icinga web shows the service as critical.
I have restarted icinga and ssh but the issue still persists.
Any ideas?

I have checked the logs on both the target server and the monitoring server but can’t find anything meaningful to assist with troubleshooting.

image

Is there a firewall rule preventing monitoring from checking tcp port 22? Are you using a different port for ssh?

If you can share (censored if private info) the Plugin Output as well it may be helpful.

No there are no firewall rules and we are using standard port 22.

Unfortunately the most useful information is cropped out of the screenshot you provided. May we know the output of the plugin?

1 Like

When I run the check manually I get the following results.

‘/usr/lib64/nagios/plugins/check_ssh’ ‘172.17.xxx.xxx’

SSH OK - OpenSSH_8.0 (protocol 2.0) | time=0.013838s;;;0.000000;10.000000

Object Properties
__name “my-server!ssh”
acknowledgement 1
acknowledgement_expiry 0
acknowledgement_last_change 1638881841.972926
action_url “”
active true
check_attempt 1
check_command ssh
check_interval 300
check_period “”
check_timeout null
command_endpoint “my-server”
display_name “ssh”
downtime_depth 0
enable_active_checks true
enable_event_handler true
enable_flapping false
enable_notifications true
enable_passive_checks true
enable_perfdata true
event_command “”
flapping false
flapping_current 0
flapping_last_change 0
flapping_threshold 0
flapping_threshold_high 30
flapping_threshold_low 25
force_next_check false
force_next_notification false
groups
ha_mode 0
handled true
host_name “my-server”
icon_image “”
icon_image_alt “”
last_check 1639053071.142867
last_hard_state 2
last_hard_state_change 1638803695.884983
last_reachable true
last_state 2
last_state_change 1638803556.983862
last_state_critical 1639053071.143917
last_state_ok 1638803246.982007
last_state_type 1
last_state_unknown 0
last_state_unreachable 0
last_state_warning 0
max_check_attempts 3
name “ssh”
next_check 1639053367.583936
next_update 1639053667.583714
notes “”
notes_url “”
original_attributes null
package “director”
paused false
previous_state_change 1638803556.983862
problem true
retry_interval 60
severity 640
state 2
state_type 1
type “Service”
vars null
version 0
volatile false
zone “monitoring.xxx.xxx.ca”

Do you run this with your (root) user or the icinga/nagios user?
what happens if you run the ssh command instead of check_ssh. By the way: if you run check_ssh with the parameter “--verbose”, you’ll see that this check runs ssh in the background. :wink:

And also very important: the host you want to connect must be in the known_hosts list. That means if it possible to run the check with the root user, than the server is in the list. If it is not possible to run this with the icinga/nagios-user that means, this user haven’t the server in its known_hosts list

What authentification you are using? Certs? Username/Password? This could also be a reason. If you use certs, maybe the icinga/nagios user is not allowed to access the certs.

For debugging I prefer to use the ssh command. Because here I saw in the past, the error messages are better than the output of check_ssh

I don’t believe this is the case. I have never had to manually accept a monitored server’s host key before check_ssh would work properly. Happy to be shown new info, just taking that from my own experience.


I believe the missing piece of information in this thread is still the output of the plugin when it fails. We can all look at the plugin’s code to see all of the possible ways in which it will return CRIT (including if it is not executable in the expected location).