HoRaX
(Mario J.)
1
Hi Everyone,
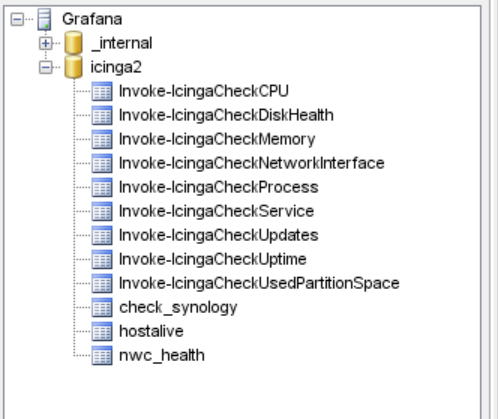
im trying to visualise SNMP Checks in Grafana.
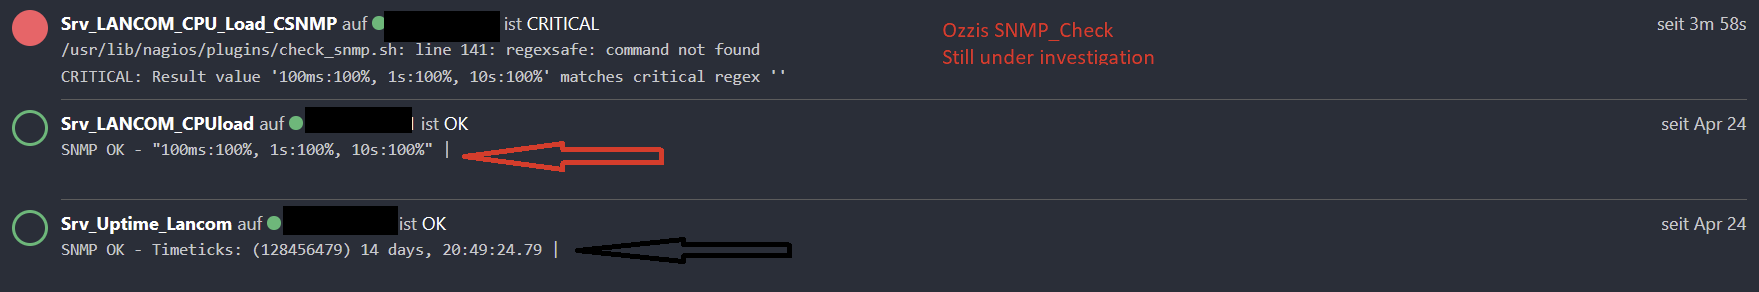
For this im using the already implemented Check_SNMP and also for testing Check_snmp from Ozzi (https://github.com/ozzi-/check_snmp).
On the Icingaside i have them running and they give me the results i expect.
But the metrics from snmp checks does not show off in the InfluxDB. I check this via InfluxDB Workbench.
I see all my other checks… but nothing from SNMP.
Did someone run into a similar issue and have a tipp for me?
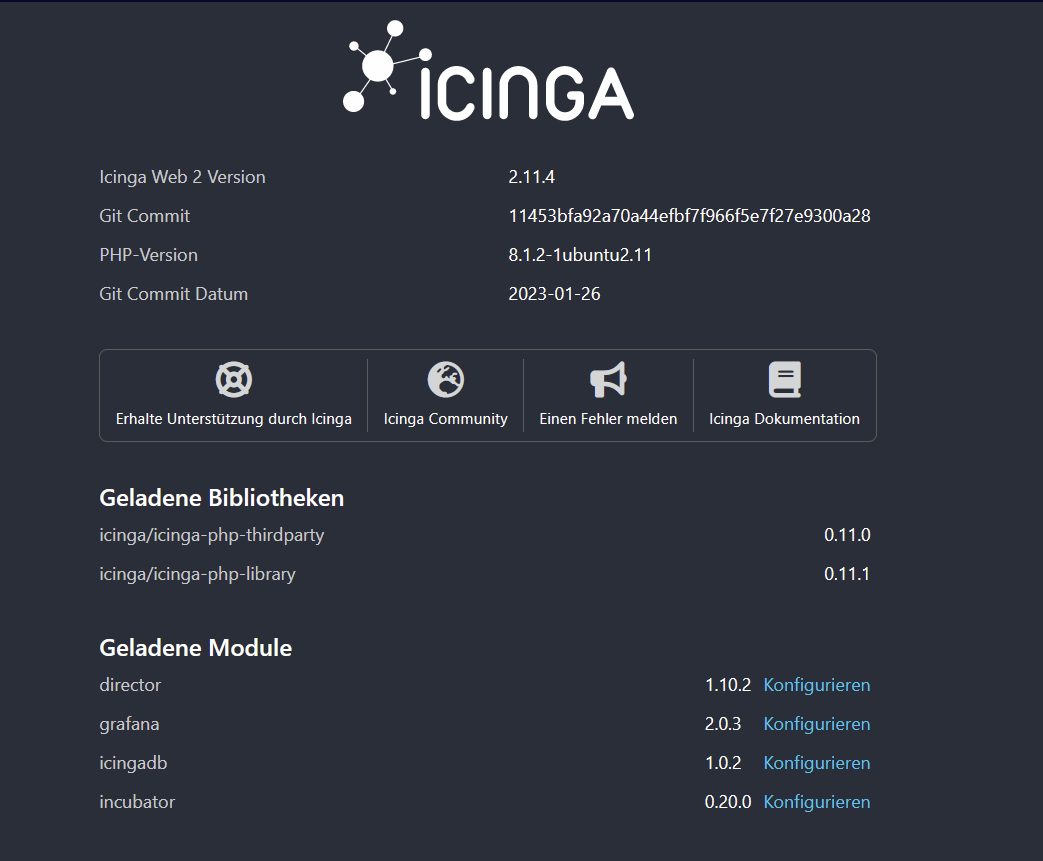
My System:
Regards
Mario
rsx
(Roland Sommer)
2
This plugins does only return one value, but your example shows 3 value pairs.
HoRaX
(Mario J.)
3
Sorry for the Delay… i was ill for a while…
this might be true, and maybe a bad example but also the check below that… which only gives timetick as value back also does not show up.
rsx
(Roland Sommer)
4
Could run any of these plugins manually and post the result? The easiest way to do so is click on Inspect and copy the line below Executed Command.
You could also enable debuglog and check for any failures.
balde13
(Alan )
5
Did you ever figure out why influxdb was not picking up the metrics data from the snmp service? I’m having the same issue with a similar snmp service.
rsx
(Roland Sommer)
6
This happens sometimes e.g. when a plugin return malformed performance data.