What criteria did you weigh up in deciding to engage Icinga?
Before I started at our company, there was a point where they had switched from Nagios to Icinga 1.x due to cultural changes (and everything ported directly over). They asked if I’d be interested in overhauling the checks and thresholds, I suggested that we needed to look at a newer system. After taking a brief look at Icinga2 and Nagios XI, I just loved the object oriented config syntax and saw it as an easy solution to scale out.
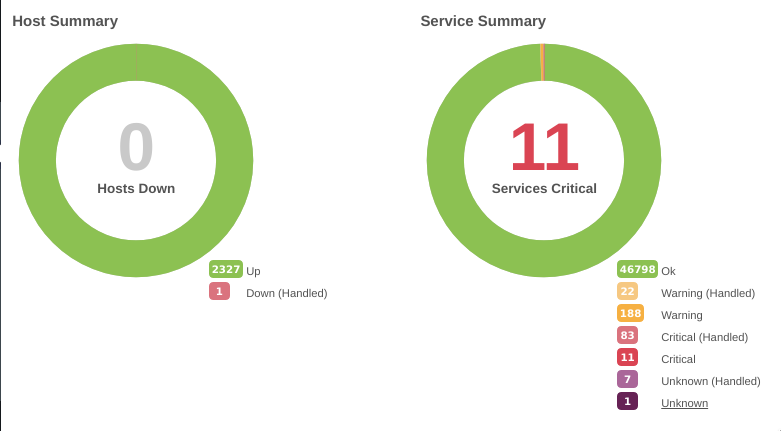
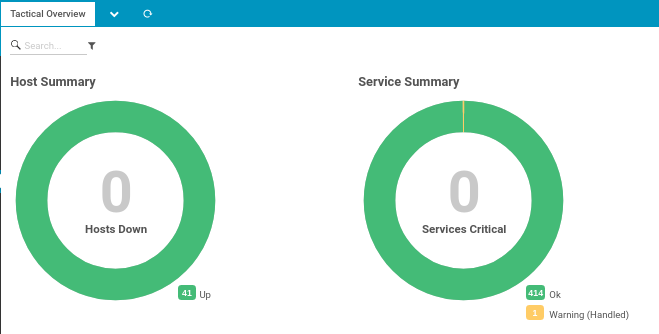
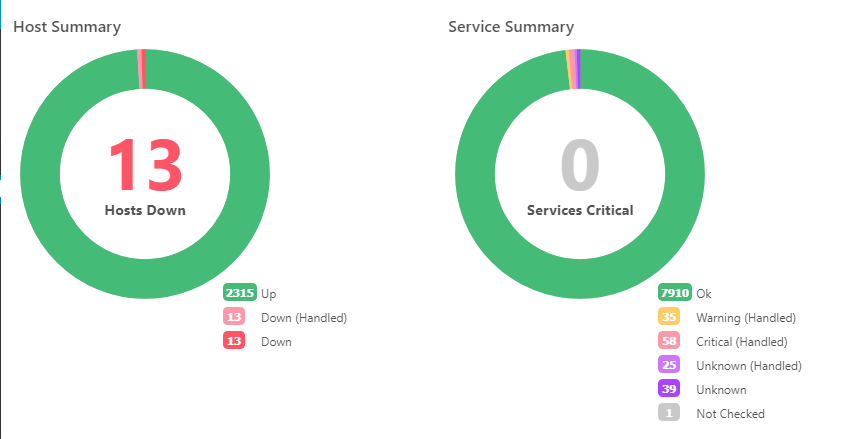
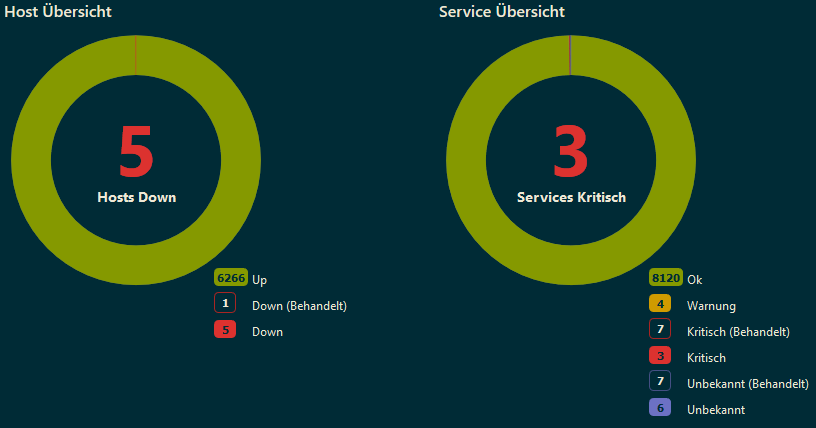
How many hosts/services do you monitor? (Hint: icinga2 daemon -C )
Always growing:
[2019-05-22 07:44:24 -0400] information/ConfigItem: Instantiated 47110 Services.
[2019-05-22 07:44:24 -0400] information/ConfigItem: Instantiated 2328 Hosts.
[2019-05-22 07:44:24 -0400] information/ConfigItem: Instantiated 1763 Zones.
[2019-05-22 07:44:24 -0400] information/ConfigItem: Instantiated 1765 Endpoints.
[2019-05-22 07:44:24 -0400] information/ConfigItem: Instantiated 303 CheckCommands.
Describe your Icinga Setup roughly (High Available, Satellites, Agents etc.)
2 masters in high-availability which also monitor the client nodes in the same data center they run in. Past that, 2 satellites in all of our other datacenters. Icingaweb is running on both with a vip we can failover if icinga-master1 is going to be dead for a while. In the freak event our main datacenter goes out entirely, I have a cronjob on the icinga satellite in our Vegas DC that just makes sure it can access the Icinga rest API remotely and will leverage pagerduty directly.
I went with postgresql for the database which is using logical replication and a hot standby. Since postgres doesn’t have an automated failover solution built in, I wrote an event handler where Icinga will fail over its own database if it can’t connect to it, and that’s the funniest thing in the world to me.
Our carbon cache daemons and relay run on one of the database servers, but we plan to get bare metal to replace these so we can have our whisper database be redundant as well (and it’s growing like the blob).
How do you add new monitoring objects? Describe your configuration workflow roughly.
I’ve written most of our config by hand, with the exception of new host/zone/endpoint objects (I would have lost my mind). I install and generate the basic configuration using a python script I wrote, but I should probably quit being a crazy person and just use Ansible. Templates and services are all a labor of love and at this point I’d be afraid of Director touching my code.
How do you integrate Icinga with your other Tools?
The custom checks we’ve been writing these days are super specific to us, so I’ve only put one hobby project on the exchange so far. A lot of our event handlers we’re writing use a Slack plugin my coworker cranked out that announces to the team what is broken and what it’s doing to fix it.
What’s that ONE piece your missing in Icinga?
The ability to run event commands on different endpoints than the check commands ran from.
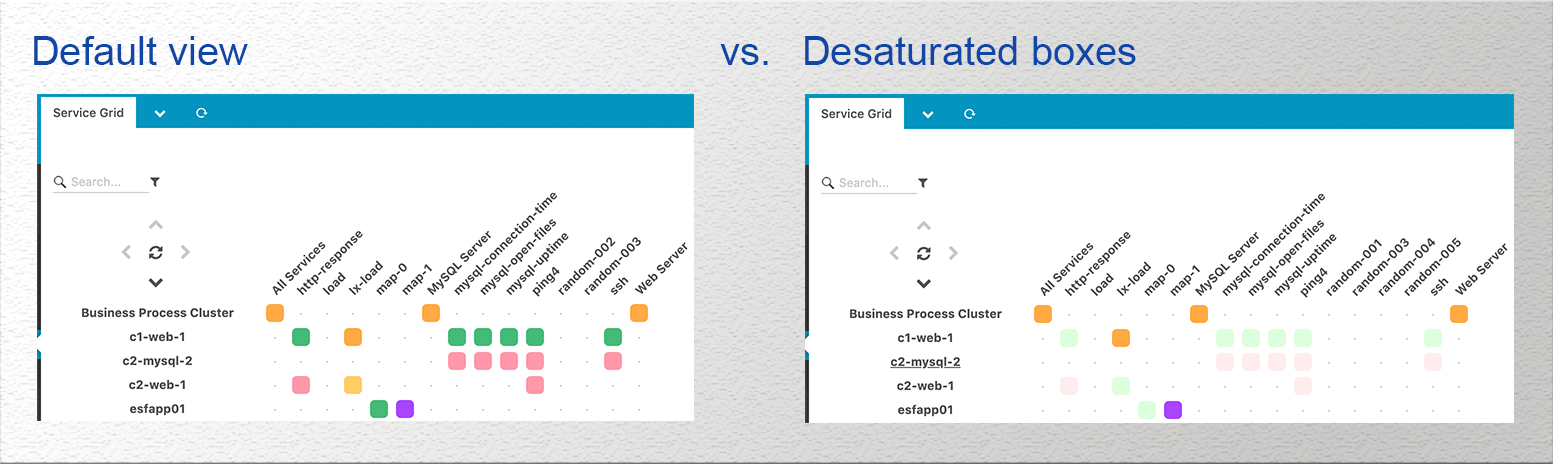
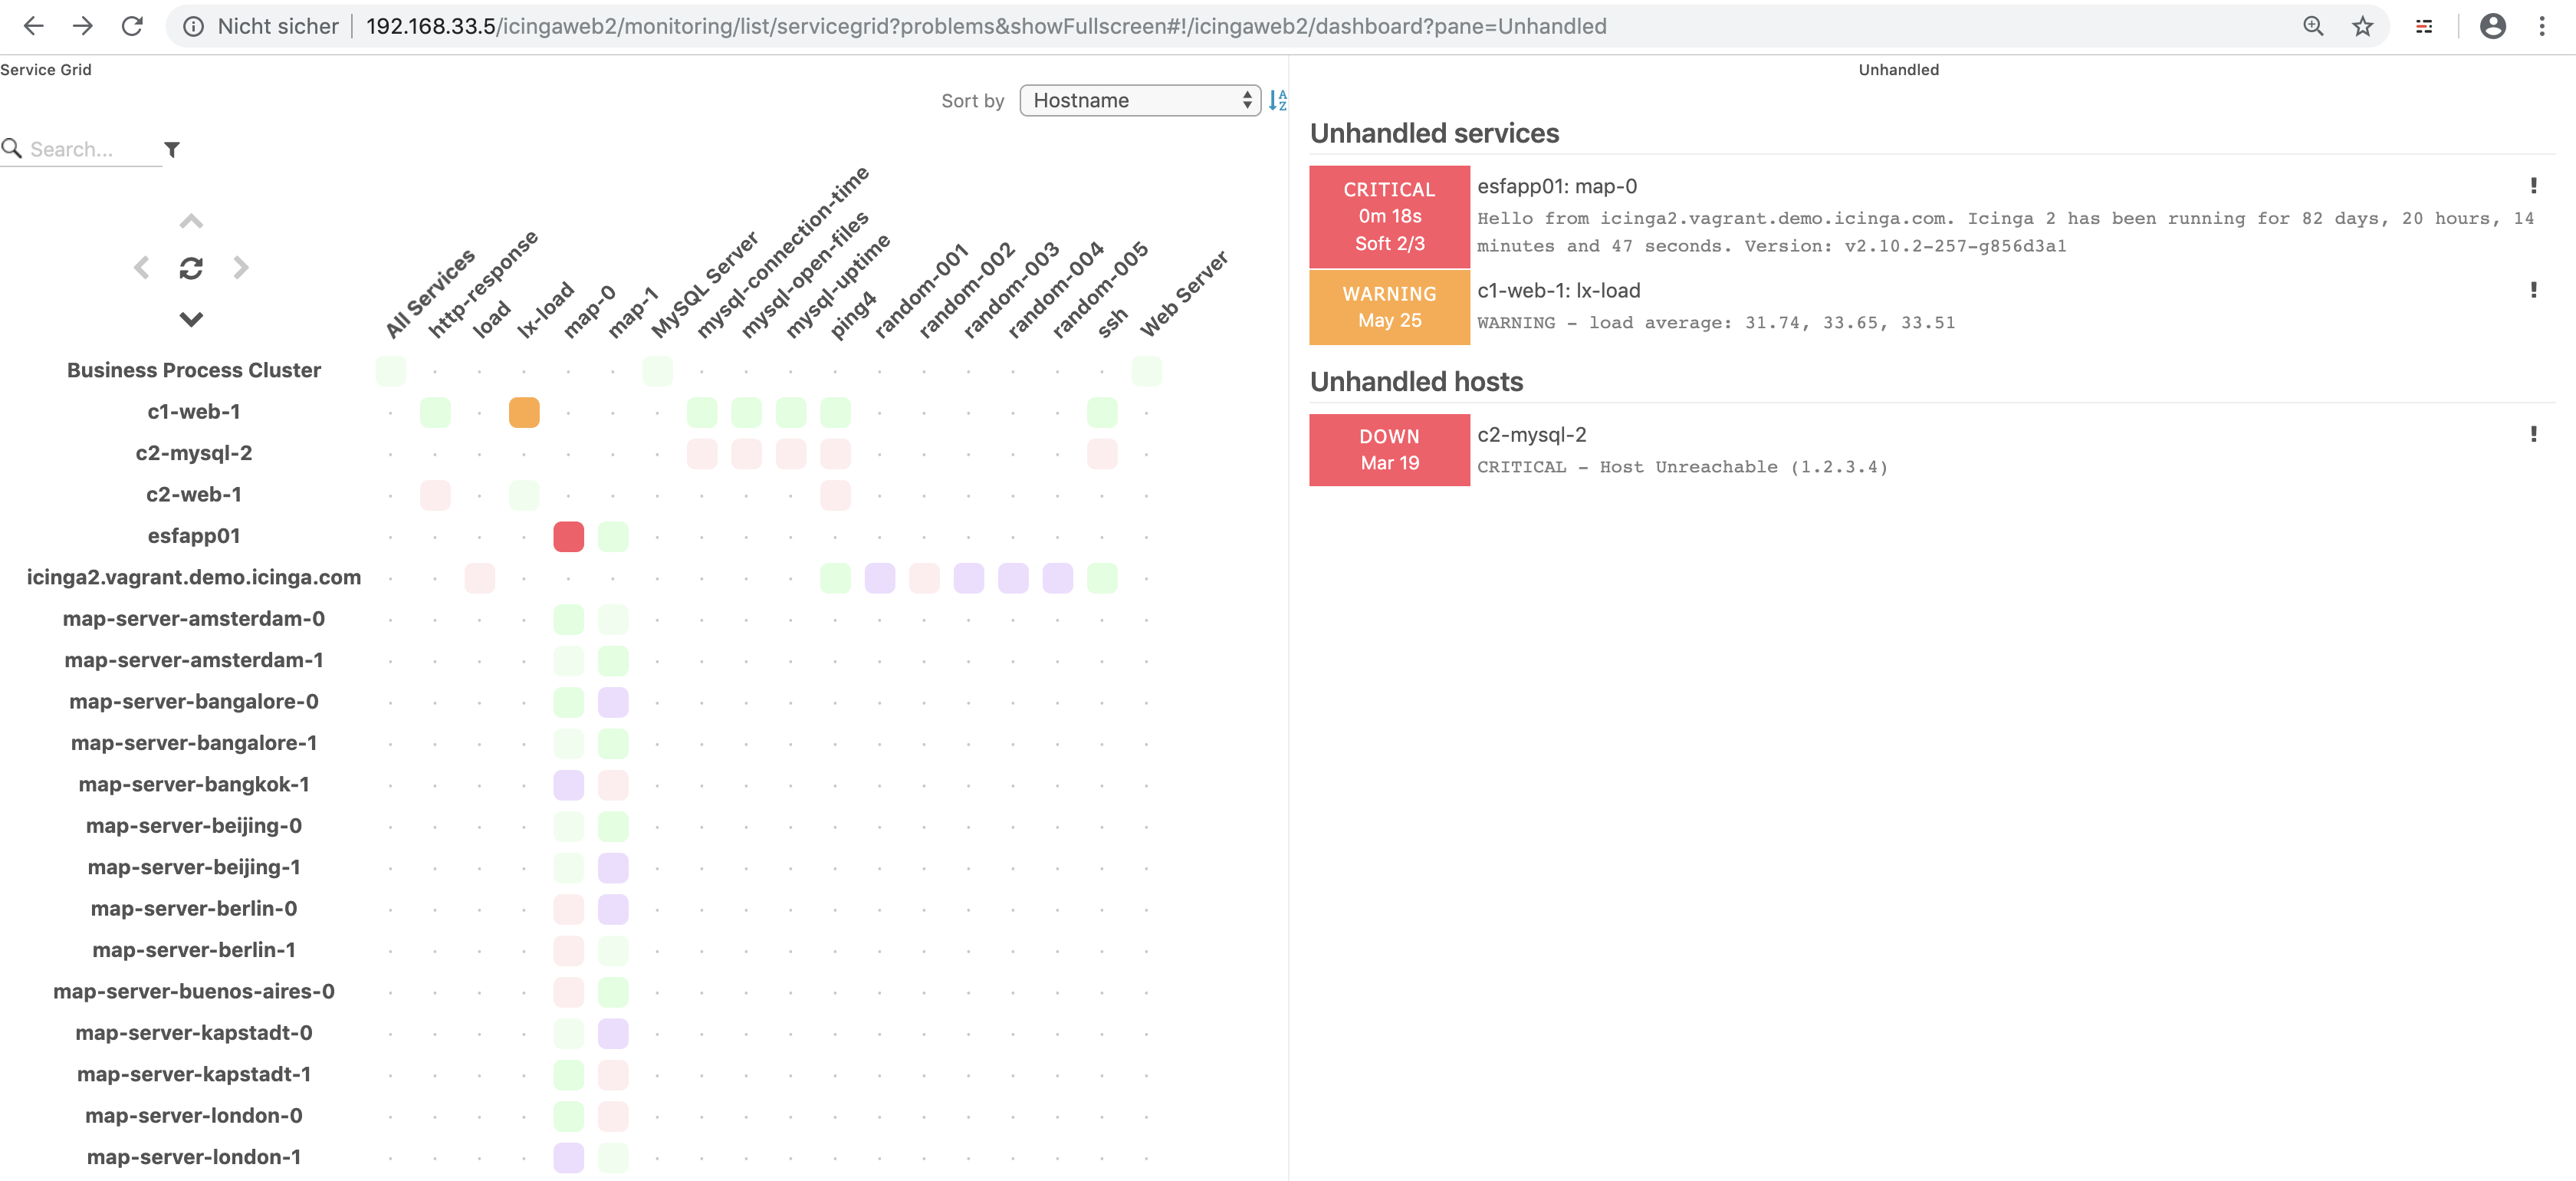
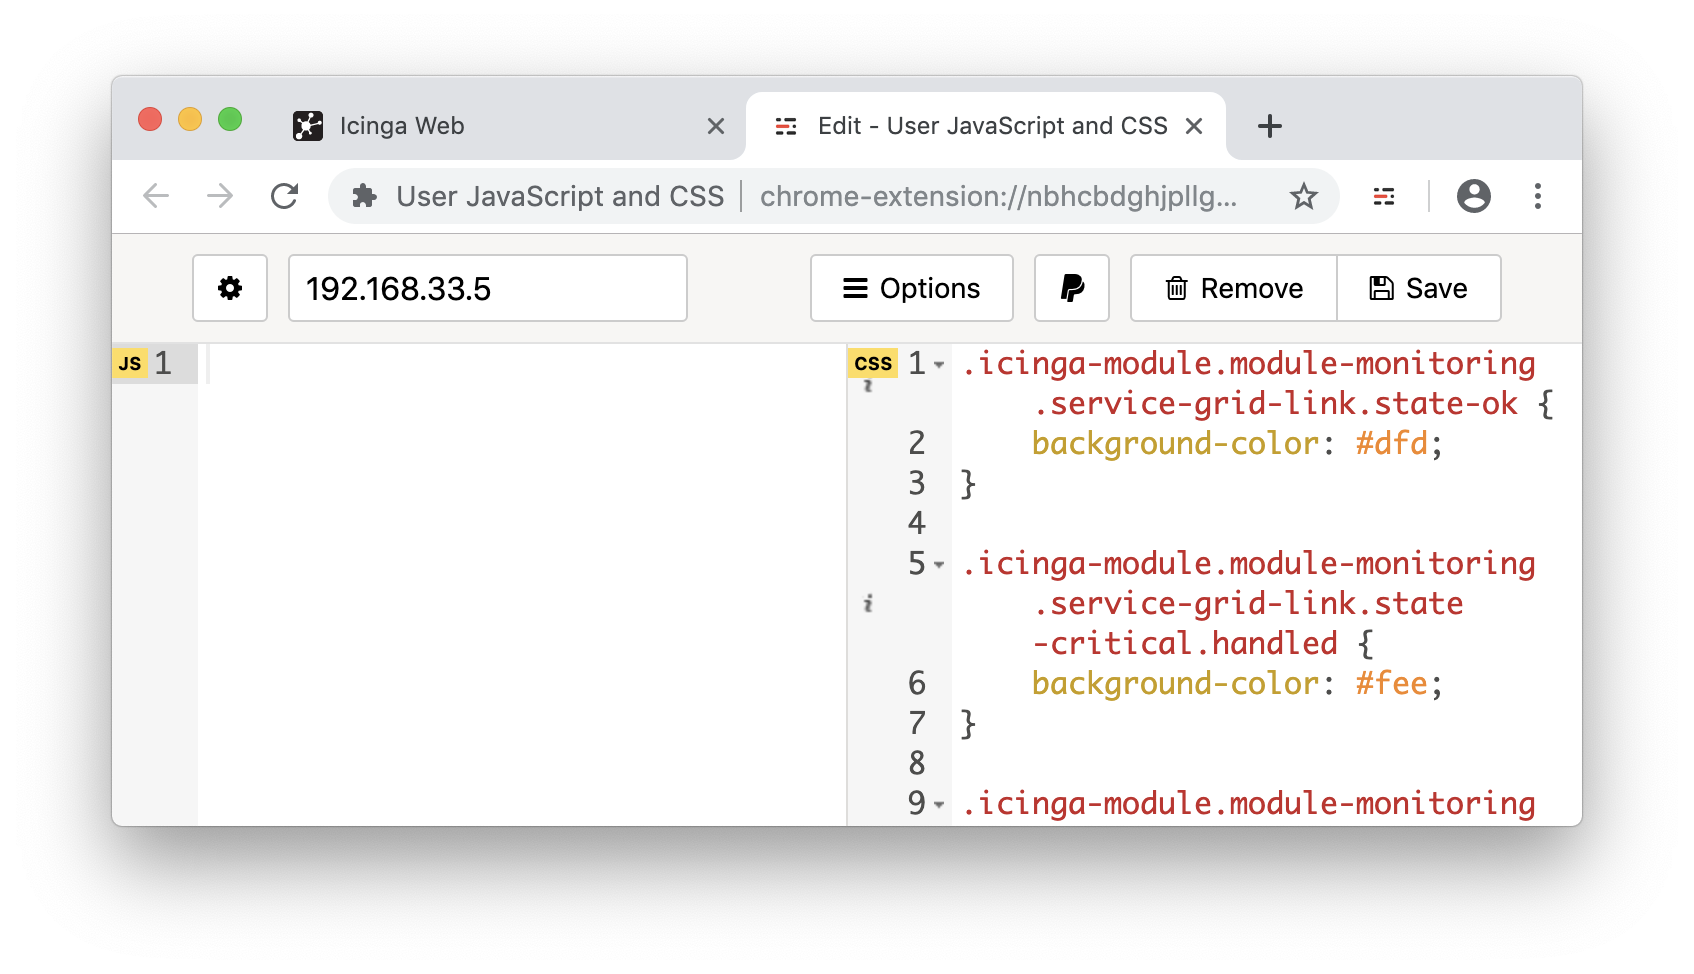
There are super specific things we need to be able to do sometimes that Icingaweb isn’t really equipped for, so not being php developer, I was stoked to see that taking a couple minutes to hack a configuration.php file will iframe and create relevant links for external applications. Building a custom toolbox in Django now since we’re mostly python guys. I really like the API.
Anyway, I just happen to be in Atlanta replacing an old Centerity setup with Icinga the week of the monitoring conference, so I’ll be seeing some of you tomorrow.


 Icinga Director