AFAIK the apply/ignore rules are kind of “static”. ~They take the state of the configuration file at execution time of the configuration check, so state changes during runtime won’t influence anything~.
[edit]They take “static” properties of the configuration objects like name, address, group membership[edit/]
They fill up with the services I create dynamically, through the API. If it doesn’t work for service status, then it ought to - it would be a very useful feature.
What do you want to achieve by this? You can filter for status in almost any view you have on the system. Icinga Web 2, API and so on. Normally you don’t need sevice groups for this.
Hi Thomas. Well, there are ways to do this through filtering, so in that sense I don’t need it, but it would just be a neat way to organise things, at least for me. Actually, I could probably get a similar effect if I created a service group like this:
object ServiceGroup "all" {
  display_name = " All services"

  assign where match("*", service.display_name)
}
I’ll try that.
======
I have chosen this solution now. Thank you to both Thomas Widhalm and Wolfgang - your insights helped me think more clearly about what I wanted and needed.
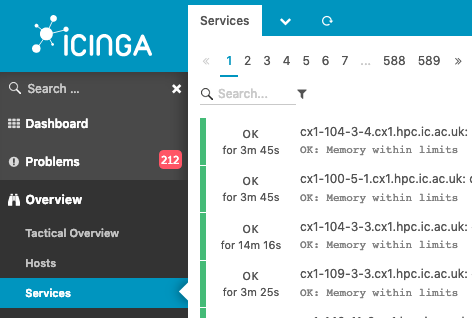
I see - you mean the ‘Tactical overview’? It’s good - but as I said, I like the format of the summaries in ‘Servicegroups’ - each on a line, so it makes sense to me to create the ‘All services’ service group. That way I don’t have to switch pages, but can see it all in one place.
No, I mean the item Overview or Übersicht in German setups in the menu on the left. (From above: Dashboard, Problems, Overview. Then Services as subitem.
Hi Thomas - I see what you mean. However, before I went ahead with creating an ‘All services’ group, which gives me something similar, I tried changing the ‘state’ groups like this:
Ok, now I see… I was confused by the fact that you created a Servicegroup out of all available services.
So it’s not about the listing but about the summary.
You can have this in the Tactical overview you mentioned already or in System/Status/Statistics. The Icinga team decided to remove any summary like you had in Nagios or Icinga 1 because while it’s nice to know for an admin, it actually doesn’t have much value and adds extra noise to the webinterface which was built for fast recognition of things you actually have to react on.
The way we think about how to use monitoring is to react on problems as you see them. Be it by solving or acknowledging. A total count might be something useful for overall assessment of how your admins are reacting but nothing you should need all too often or all too quickly when something bad happens.
But there’s nothing wrong with having a host-/servicegroup like you said if you want these summaries.
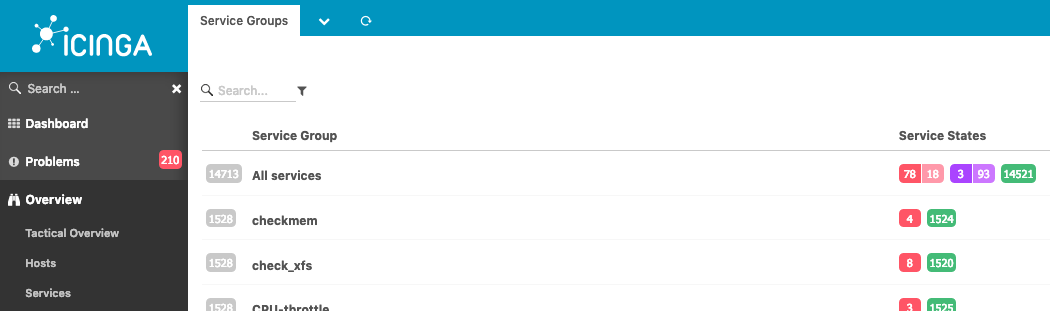
The nice about the summaries is that they are clickable: when I see there are 4 critical erros in checkmem, I can click the icon and get to a list of those. As you can sense, I create 1 service group for each service, which summarises across all the child nodes, so I can get a sense of whether there are widespread problems of a certain kind, and then go and see if they are perhaps of the same nature or not.
This is what Problems/Service Grid is for. You see, we have you covered.
Please don’t get me wrong. If you want to have the Servicegroups, go ahead. I just want to show you that with Icinga 2 you have new, normally more powerful alternatives to the way we did things with Nagios.
For your initial question: You can’t create Servicegroups based on current status but there are other ways. Like the default dashboard, the service grid etc.
Oh, and actually, although the service grid is good, in my case it becomes an uncomfortably long list - at the time of writing we have some 14000 services, and I’m only half done.
Great to hear that you have such a big setup! Congrats.
<developermode>People should fix their alarms so you should have very few alarms anyway so the grid should be enough.</developermode>
<consultantmode>I know, right. People just don’t fix their problems and you end up with a long list of problems. I hear ya, bro.</consultantmode>
(please see this as a joke, not an offence)
So, theoretically, the service grid should be enough but practically there has been some effort to allow for bigger overviews in the past. Honestly I don’t know the current status. I’ll go and ask if there are still some things going on I couldn’t find on the issues list.
People, IOW me, are amazing at fixing things, but the grid still consists of a lot of lines. I do see a lot of problems in certain categories, like shared filesystems - this will normally be the same problem across all systems. Being able to sum things up is a great help.
And don’t worry about causing offence - I once worked with somebody who thought it would be a great joke to put tear gas in the air freshener. You learn to be tolerant that way. Or paranoid.
How a about some “summary grid” where you don’t see what service is not-Ok on which host but get a list of Services with a count on how many hosts they are not-Ok. We could file an issue for that.


 maybe, but dynamically created in Web without the need to configure them.