I work for an MSP and we use Icinga2 internally to monitor customer devices, including all workstations/notebooks.
~100 Notebooks are configured with one-way connectivity. The intention is that supported devices can communicate back to a WAN IP from anywhere.
I have configured the host check to be the built-in cluster-zone command. The hosts will almost never be pingable, a traditional ping host check wouldn’t work. All services are dependent on “Agent Health” where the command is cluster. I have enabled Active and Passive Checks, Notifications, and Event Handler. While devices are online, this works quite well.
The problems start when the device sleeps or is coming back online. We will immediately receive a notification for every service on the host right before they all recover. Sometimes the problem notifications and recoveries come at the same time. The issue is creating alarm fatigue in our techs
Can anyone explain why this happens and how I can implement this without these notifications?
I’d really like to know if the “not connected” messages are from the notebook agent or from the satellite/parent. I need the statistics, and it must produce notifications for things like 100% full disks while users are working from home. I don’t care if we’re not getting results because the device is offline.
Hi @XilityWorks ,
hm, that is probably going to be a tricky one. Icinga 2 ist pretty much built from/for a “server” setup, meaning having 24/7 connectivity, so this here is a bit unconventional.
First things first, you did configure Dependencies, did I read that right? Meaning a dependency on all Services if the connection to the Icinga Infrastructure fails.
How are you configuring this setup? Using the Icinga Director or plain text configuration?
I am not sure if the alerts seen on the console are the issue, or if the notifications (emails or other) are the issue, or both.
First, I would configure a small check period for the host, and a slightly longer period for the dependent services.
For the alerts on the console, I would setup a filter excluding the alerts for services related to hosts that are down, and the alerts that are not yet in a hard state.
For the notifications, I would setup a delay that guarantees the notification will only be sent for the ascertained failing checks.
@lorenz would a Monitoring Basics - Icinga 2 help to get rid of the “Sometimes the problem notifications and recoveries come at the same time.“ problem?
Right now, all services on these hosts are dependent on “Agent Health” (cluster) and I am using Director exclusively.
I thought I was clever and started exploring passive checks. I discovered I am also getting stuck in a catch-22. I have configuration syncing enabled so we can modify overrides or add new services without needing manual reconfiguration of hundreds of devices. What I didn’t realize was that toggling “Active Checks” in Director will sync this toggle to the endpoint. I thought this was to stop the satellite from scheduling checks and left it on the endpoint.
The only solution I found to this was to disable active checks, then create scheduled tasks to run the required cmdlets and submit the results back.
Am I barking up the wrong tree or is this a good alternative?
Do you mean check interval? All devices are checked 24/7. I don’t have a great way to change that.
If you meant interval, the parent service is set to 3 soft states while the offending are 6. This adds 3 minutes of buffer.
I’m somewhat confident it isn’t a notification delay issue. 5 soft states would still take 5 minutes to come online, get connected, and perform a successful check.
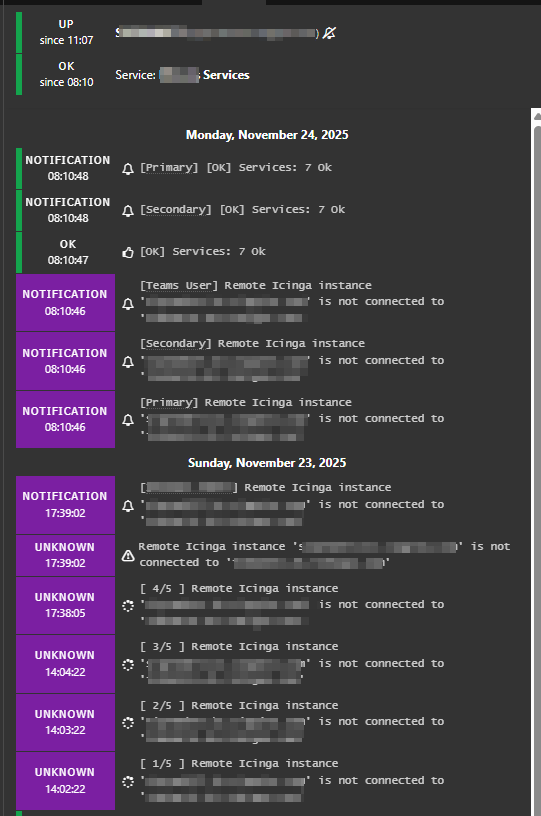
This morning, I can see this timeline:
To me, this looks like the first of 5 soft states were reached on Sunday. We sent a single admin notification. This would be after-hours work so it doesn’t send to primary/secondary.
But then when the device comes online at 8:10:46, it notifies everyone via Teams then primary and secondary that there is an issue… before immediately sending an “ok” 1 second later. This exact behavior occurs for every service.
My concern is receiving notifications for an issue we can’t explain. This in combination with immediately being told the mystery issue is fixed leads to alert fatigue. I’d like to figure out the mystery issue.
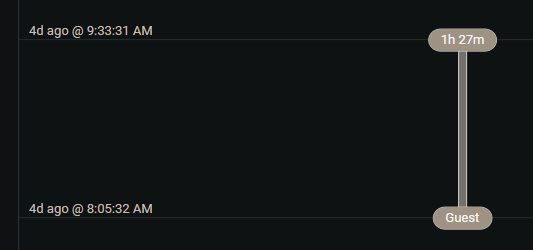
I think most of this is in the first bullet is in the previous post with a screenshot. I’m not sure what service starts and stops you’re referring to in my scenario. It looks like the host had enough connectivity to connect to our screen control host 5 minutes before these notifications were triggered. The host reconnected to Screen Connect at 8:05:32, then produced problem notifications and recovery notifications at 8:10:46 and 8:10:47.
These checks are scheduled to run 24/7. Considering the host is offline in this scenario, I have no way of knowing what time the checks that produced these notifications were executed. Considering my retry interval is not 1 second, I find it unlikely it actually ran at 8:10:46, returned a bad result, then ran it again with an OK result 1 second later.
What I find most unlikely is that the device came online, had sufficient connectivity to connect over the public internet to the ScreenConnect server for over 5 minutes, but was unable to connect to Icinga within this time.
To me, this seems like the agent is running checks when it doesn’t have connectivity then just spooling up “I’m not connected to my satellite” messages. These are then getting sent to the satellite via log replay and causing notifications for old issues that immediate recover when an up-to-date check runs.