I’ve found an unexpected behavior of a scheduled downtime for a service in Icinga 2.10.5.
Setup: flexible downtime with duration of 15 min, daily between 00:00 and 00:30.
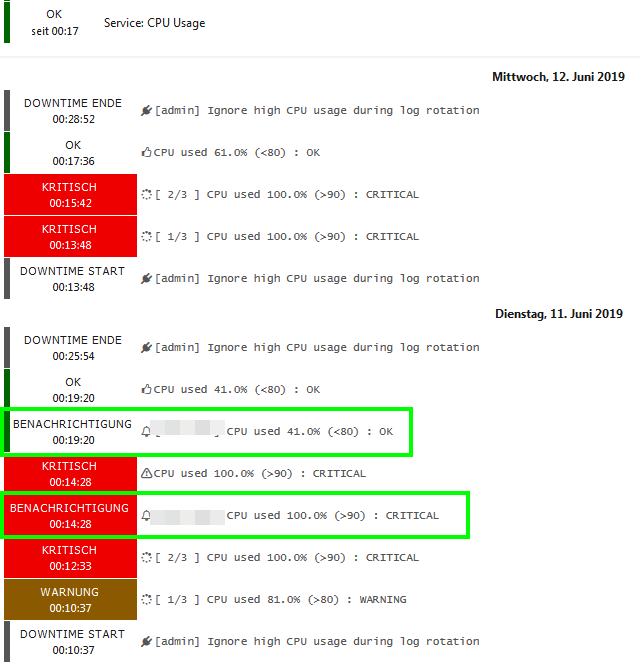
Downtime started after first state change to warning, after short time changed to critical, but notification was not suppressed (screenshot, date June 11th).
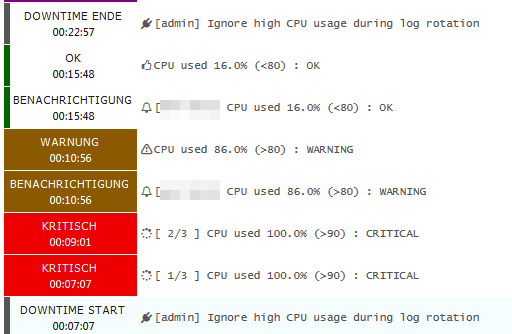
Hm, is this reproducible with a specific day of the week or pattern? Looks like the service needs to always reach the hard state - June 12th doesn’t show that.
Here’s another case where it did’nt work as expected. Seems that only critical states are considered.
Max check attempts for service is set to 3, but with 3rd attempt state changes from crit to warn, then
the notification is sent even if we are in downtime.
Downtime Config from Director:
apply ScheduledDowntime "LogRotationMgt" to Service {
    author = "admin"
    comment = "Ignore high CPU usage during log rotation"
    fixed = false
    duration = 15m
    assign where service.name == "CPU Usage" && match("test*", host.vars.host_role)
    ranges = {
        "friday"	= "00:00-00:30"
        "monday"	= "00:00-00:30"
        "saturday"	= "00:00-00:30"
        "sunday"	= "00:00-00:30"
        "thursday"	= "00:00-00:30"
        "tuesday"	= "00:00-00:30"
        "wednesday"	= "00:00-00:30"
    }
}
Ok, is that specific notification event sent to any users configured in your notification apply rules? It may be the case that a notification itself is triggered, but no users have been notified about it - this is something not directly visible for the brown row. (e.g. an email as proof).
Hm, is there a reload/restart in that time window? I could imagine that after the downtime start event, the core gets restarted and the _api package is broken.
No reload/restarts at this time, but found cron job for logrotation of icinga2.log which sends USR1 signal to icinga2. Happens usually daily at 00:01:01 by logrotated script. Logfile shows no error after USR1 signal until end of scheduled downtime (00:00-00:30).
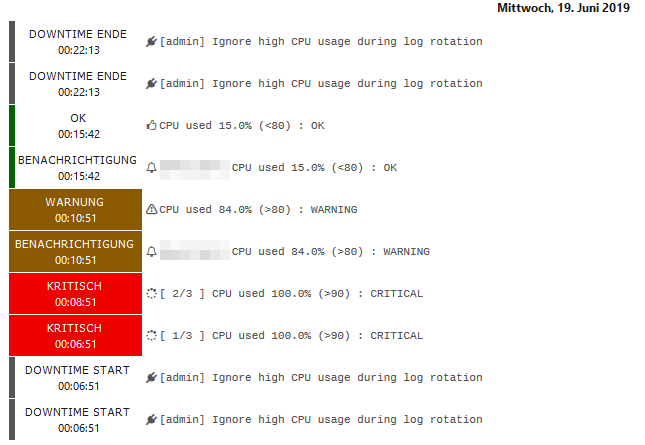
Changed downtime window to 00:02-00:30 for testing.
Hm, no change - notification is still sent.
But now Icincaweb2 shows two downtimes, the old one seems not to be deleted after changing start time when looking into history of service.
When looking into Overview/Downtimes, there is only one downtime (with the changed start time 00:02)???