Hey there,
I’m using Icinga2 with Grafana and InfluxDB, and the Graphs are displayed very well in Icinga2 itself.
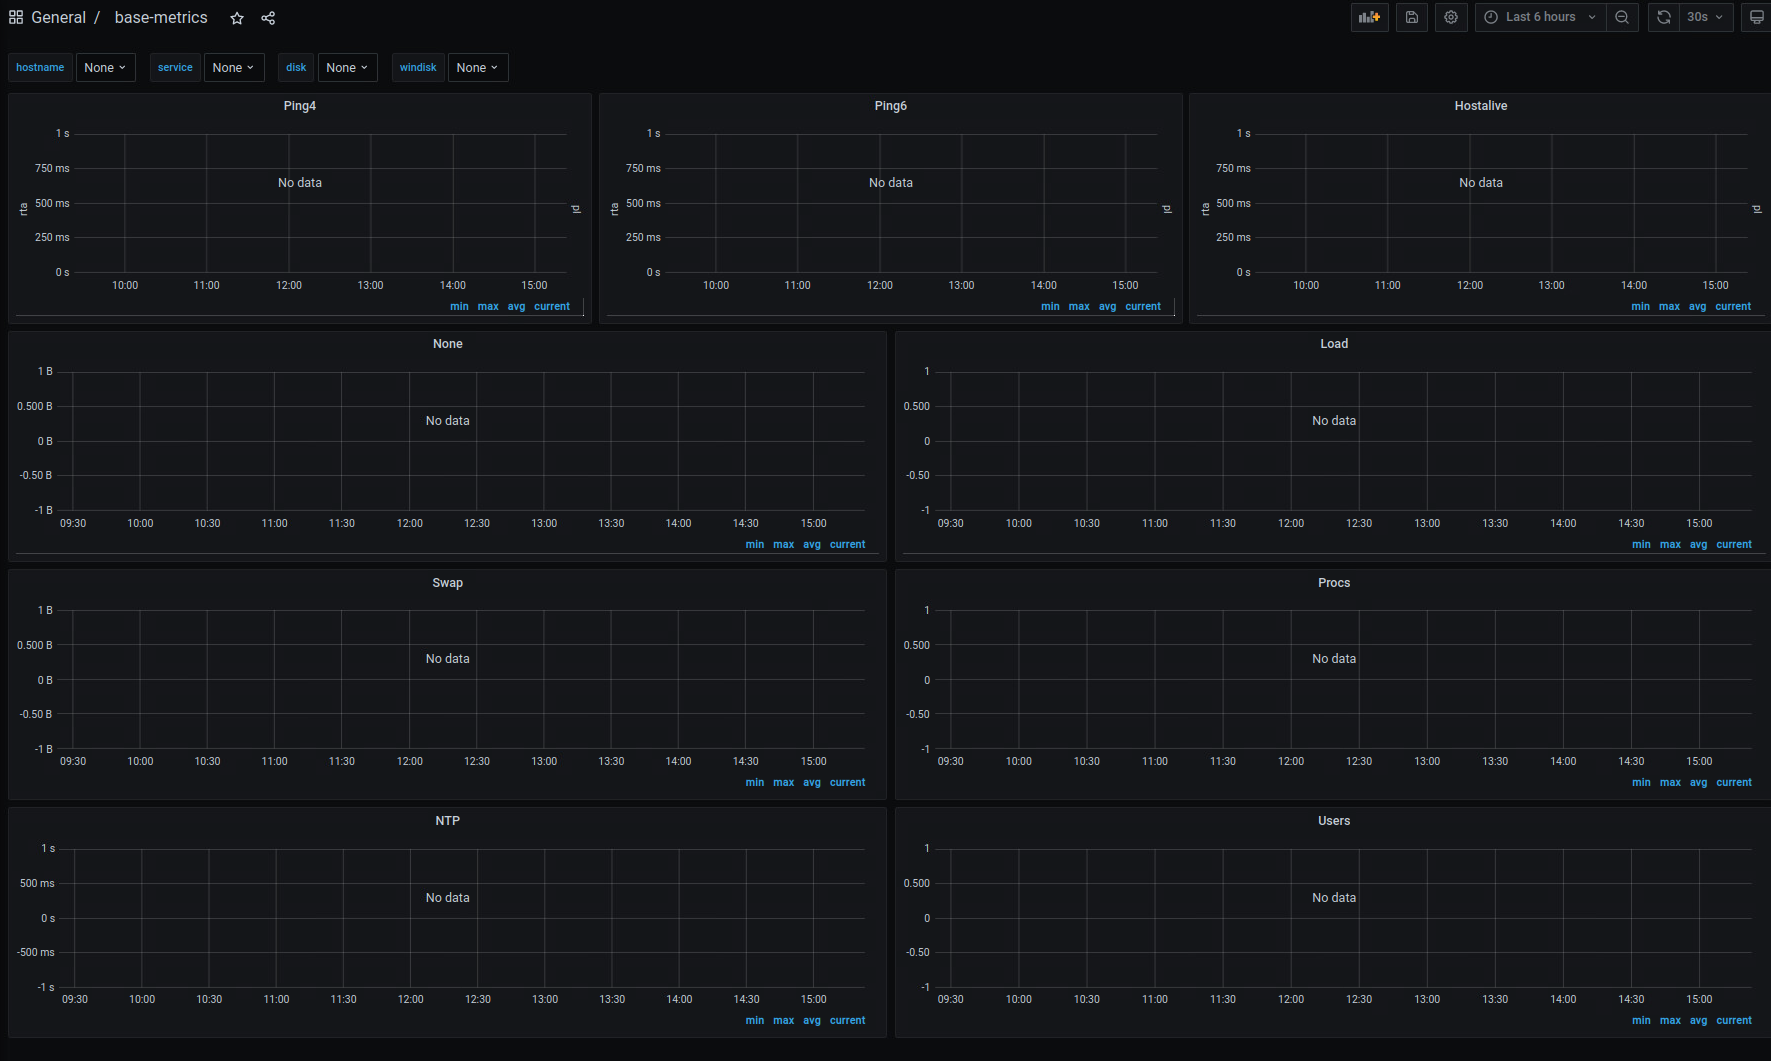
But on my Grafana Web-Interface I don’t see any data on the Graphs on all of my importet dashboards. There are just no data points visible, and I’m not able to choose from the dropdown-menu for hosts etc. See the attached screenshot of one of my used dashboards:
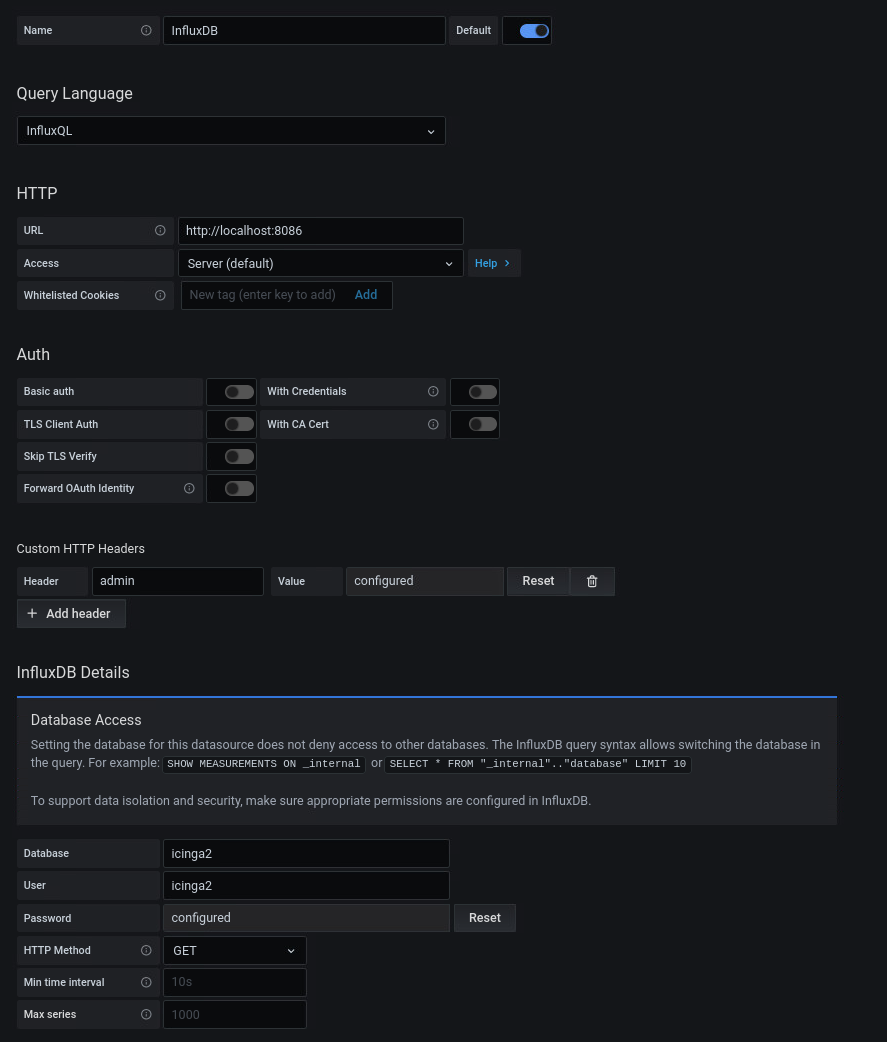
My settings in Grafana are as followed:
The Icinga2-Default dashboard is also only showing one emtpy graph instead of the many that are visible in my Icinga2-environment.
Can anyone help me on this? Or is it even something that can be ignored?
Greetings