Hello
Trying to make hands dirty after @cstein pushed me to powershell framework
I generated a event ID : 3201
My Single Service Looks Like below
apply Service "XXX-P_MS_P_EvtLogID3201" {
    import "XXX-tmplService-MS-PS_EventLog"
    assign where "XXX-tmplHost-MS" in host.templates
    vars.IcingaCheckEventlog_Array_IncludeEventId = [ "3201" ]
    vars.IcingaCheckEventlog_Object_Warning = "1"
    vars.IcingaCheckEventlog_String_LogName = "Application"
    import DirectorOverrideTemplate
}
My Service Template Looks Like Below
template Service "XXX-tmplService-MS-PS_EventLog" {
    import "XXX-tmplService-Default"

    check_command = "Invoke-IcingaCheckEventlog"
    check_interval = 15m
    command_endpoint = host_name
    vars.IcingaCheckEventlog_Int32_Verbosity = "3"
}
then I generated a event like below on the server
$evt = new-object System.Diagnostics.EventLog("Application")
$evt.Source = "MyEvent"
$infoevent = [System.Diagnostics.EventLogEntryType]::Information
$evt.WriteEntry("My Test Event",$infoevent,3201)
I see the event in the eventLog
log1c
September 1, 2020, 8:54am
2
The documentation of the plugin says that the warning and critical thresholds are the number of events above which the check exits with a warning or critical.
# Invoke-IcingaCheckEventlog

## Description

Checks how many eventlog occurrences of a given type there are.

Invoke-IcingaCheckEventlog returns either 'OK', 'WARNING' or 'CRITICAL', based on the thresholds set.
e.g Eventlog returns 500 entries with the specified parameters, WARNING is set to 200, CRITICAL is set to 800. Thereby the check will return WARNING.

More Information on https://github.com/Icinga/icinga-powershell-plugins

## Arguments

| Argument | Type | Required | Default | Description |
| ---      | ---  | ---      | ---     | ---         |
| Warning | Object | false |  | Used to specify a Warning threshold. |
| Critical | Object | false |  | Used to specify a Critical threshold. |
| LogName | String | false |  | Used to specify a certain log. |
| IncludeEventId | Array | false |  | Used to specify an array of events identified by their id to be included. |
show original
Have you tried checking for any other events to see if the check basically works?
Haven’t used the check myself yet, so I can just do fingerpointing
Exactly So. My requirement is if I see the eventID 3201 even one time or more then one time I should be alerted with a warning.
I was following the document → Icinga Plugins - Icinga for Windows
I changed it to the following
apply Service "XXX-P_MS_P_EvtLogID3201" {
    import "XXX-tmplService-MS-PS_EventLog"


    assign where "XXX-tmplHost-MS" in host.templates
    vars.IcingaCheckEventlog_Array_IncludeEventId = [ "3201" ]
    vars.IcingaCheckEventlog_Object_Warning = "~:1"
    vars.IcingaCheckEventlog_String_LogName = "Application"
    vars.IcingaCheckEventlog_Switchparameter_DisableTimeCache = true

    import DirectorOverrideTemplate
}
Also I disabled the time cache = true so that it looks historical
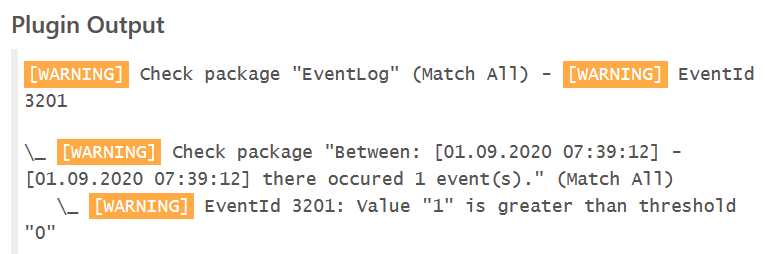
I am getting the below
But It should be Warning instead of OK. Also strangely and very strangely the plugin do not have information on the message which is very critical in log monitoring to publish the source and the message. Is this normal or am I doing something really silly
EDIT:
Yes i was being silly. To raise alert we need to be more than 0.
But no Message
1 Like
log1c
September 1, 2020, 11:08am
4
That would have been my next suggestion
Maybe create a feature request for the plugin to add this functionality.
Thanks
Created a new enhancement request
opened 04:38AM - 02 Sep 20 UTC
Hello
Please add Unique (Message) and Unique (Source) Fields in the Plugin Output.
Message : This is particularly important because there can be...
But the major problem is different - Why on earth it is raising soft state. My Service Template only has check_interval = 15m not even sampling interval
log1c
September 1, 2020, 12:08pm
6
I would suggest you open another thread for this, as it is a different problem which (most likely) has nothing to do with the PowerShell plugins
 telling me this is the way to move forward.
 what did I do wrong