- edits for clarity
I’m running Icinga2 with Director and PNP4Nagios. I’ve noticed that the graphs are inconsistent and I cannot determine why.
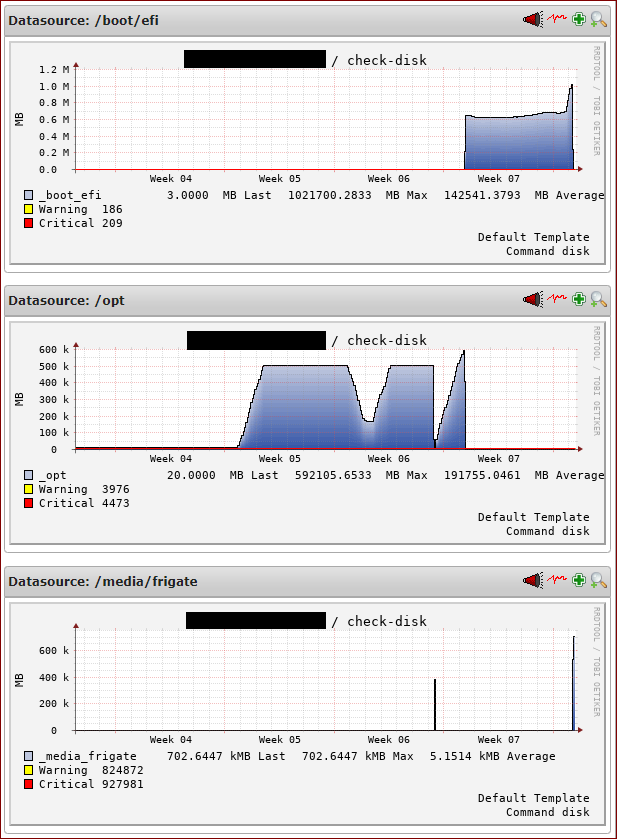
Specifically, this is for the check-disk, I have a Frigate installation and a week ago I rebooted the server after patching, then I rebooted again after updating Frigate this morning.
I noticed that when I reboot, the graphs appear to be shifting. /media/frigate to /boot/efi, /boot/efi to /opt, etc.
What is showing as /opt was showing as /boot/efi this morning, and as /media/frigate a week ago.
What is showing as /boot/efi was showing as /media/frigate until today’s reboot.
Based on the disk size involved, I know this is my /media/frigate drive.
I use LVM drives and have a lot of partitions. This is due to security baseline best practices.
df -h
Filesystem                               Size  Used Avail Use% Mounted on
udev                                     471M     0  471M   0% /dev
tmpfs                                     98M  820K   97M   1% /run
/dev/mapper/vgbase-lvbase                4.9G  3.0G  1.7G  65% /
tmpfs                                    488M     0  488M   0% /dev/shm
tmpfs                                    5.0M     0  5.0M   0% /run/lock
/dev/sda2                                688M   87M  552M  14% /boot
/dev/sda1                                234M  3.4M  230M   2% /boot/efi
/dev/mapper/vghome-lvhome                988M  503M  419M  55% /home
/dev/mapper/vgtmp-lvtmp                  988M  3.4M  918M   1% /tmp
/dev/mapper/vgopt-lvopt                  4.9G  206M  4.4G   5% /opt
/dev/mapper/vgvar-lvvar                  9.8G  630M  8.7G   7% /var
/dev/mapper/vgvarlog-lvvarlog            4.9G  297M  4.3G   7% /var/log
/dev/mapper/vgvartmp-lvvartmp            988M  2.6M  919M   1% /var/tmp
/dev/mapper/vgvarlogaudit-lvvarlogaudit  988M  2.6M  919M   1% /var/log/audit
tmpfs                                     98M     0   98M   0% /run/user/1004
Version info:
sudo icinga2 -V
icinga2 - The Icinga 2 network monitoring daemon (version: r2.13.2-1)

Copyright (c) 2012-2022 Icinga GmbH (https://icinga.com/)
License GPLv2+: GNU GPL version 2 or later <https://gnu.org/licenses/gpl2.html>
This is free software: you are free to change and redistribute it.
There is NO WARRANTY, to the extent permitted by law.

System information:
  Platform: Debian GNU/Linux
  Platform version: 11 (bullseye)
  Kernel: Linux
  Kernel version: 5.10.0-11-amd64
  Architecture: x86_64

Build information:
  Compiler: GNU 10.2.1
  Build host: runner-hh8q3bz2-project-298-concurrent-0
  OpenSSL version: OpenSSL 1.1.1k  25 Mar 2021

Application information:

General paths:
  Config directory: /etc/icinga2
  Data directory: /var/lib/icinga2
  Log directory: /var/log/icinga2
  Cache directory: /var/cache/icinga2
  Spool directory: /var/spool/icinga2
  Run directory: /run/icinga2

Old paths (deprecated):
  Installation root: /usr
  Sysconf directory: /etc
  Run directory (base): /run
  Local state directory: /var

Internal paths:
  Package data directory: /usr/share/icinga2
  State path: /var/lib/icinga2/icinga2.state
  Modified attributes path: /var/lib/icinga2/modified-attributes.conf
  Objects path: /var/cache/icinga2/icinga2.debug
  Vars path: /var/cache/icinga2/icinga2.vars
  PID path: /run/icinga2/icinga2.pid
Other version info:
Director = 1.81
Doc = 2.95
Incubator = 0.6.0
IPL = 0.5.0
Monitoring = 2.95
PNP = 1.0.1
ReactBundle = 0.9.0
Log data from this morning’s reboot (/var/log/icinga2/icinga2.log):
[2022-02-21 06:30:45 -0800] information/ConfigObject: Dumping program state to file '/var/lib/icinga2/icinga2.state'
[2022-02-21 06:31:00 -0800] warning/JsonRpcConnection: API client disconnected for identity 'frigate.mydomain.com'
[2022-02-21 06:31:00 -0800] warning/ApiListener: Removing API client for endpoint 'frigate.mydomain.com'. 0 API clients left.
[2022-02-21 06:31:02 -0800] information/ApiListener: Reconnecting to endpoint 'frigate.mydomain.com' via host '10.42.21.5' and port '5665'
[2022-02-21 06:31:02 -0800] critical/ApiListener: Cannot connect to host '10.42.21.5' on port '5665': Connection refused
[2022-02-21 06:31:12 -0800] information/IdoMysqlConnection: Pending queries: 2 (Input: 3/s; Output: 3/s)
[2022-02-21 06:31:12 -0800] information/ApiListener: Reconnecting to endpoint 'frigate.mydomain.com' via host '10.42.21.5' and port '5665'
[2022-02-21 06:31:22 -0800] information/WorkQueue: #5 (ApiListener, RelayQueue) items: 0, rate: 1.9/s (114/min 574/5min 1728/15min);
[2022-02-21 06:31:27 -0800] critical/ApiListener: Timeout while reconnecting to endpoint 'frigate.mydomain.com' via host '10.42.21.5' and port '5665', cancelling attempt
[2022-02-21 06:31:27 -0800] critical/ApiListener: Cannot connect to host '10.42.21.5' on port '5665': Operation canceled
[2022-02-21 06:31:28 -0800] information/ApiListener: New client connection for identity 'frigate.mydomain.com' from [::ffff:10.42.21.5]:57418
[2022-02-21 06:31:28 -0800] information/ApiListener: Sending config updates for endpoint 'frigate.mydomain.com' in zone 'frigate.mydomain.com'.
[2022-02-21 06:31:28 -0800] information/ApiListener: Syncing configuration files for global zone 'director-global' to endpoint 'frigate.mydomain.com'.
[2022-02-21 06:31:28 -0800] information/ApiListener: Finished sending config file updates for endpoint 'frigate.mydomain.com' in zone 'frigate.mydomain.com'.
[2022-02-21 06:31:28 -0800] information/ApiListener: Syncing runtime objects to endpoint 'frigate.mydomain.com'.
[2022-02-21 06:31:28 -0800] information/ApiListener: Finished syncing runtime objects to endpoint 'frigate.mydomain.com'.
[2022-02-21 06:31:28 -0800] information/ApiListener: Finished sending runtime config updates for endpoint 'frigate.mydomain.com' in zone 'frigate.mydomain.com'.
[2022-02-21 06:31:28 -0800] information/ApiListener: Sending replay log for endpoint 'frigate.mydomain.com' in zone 'frigate.mydomain.com'.
[2022-02-21 06:31:28 -0800] information/ApiListener: Finished sending replay log for endpoint 'frigate.mydomain.com' in zone 'frigate.mydomain.com'.
[2022-02-21 06:31:28 -0800] information/ApiListener: Finished syncing endpoint 'frigate.mydomain.com' in zone 'frigate.mydomain.com'.
[2022-02-21 06:31:28 -0800] information/JsonRpcConnection: Received certificate request for CN 'frigate.mydomain.com' signed by our CA.
[2022-02-21 06:31:28 -0800] information/JsonRpcConnection: The certificate for CN 'frigate.mydomain.com' is valid and uptodate. Skipping automated renewal.
[2022-02-21 06:31:32 -0800] information/WorkQueue: #6 (ApiListener, SyncQueue) items: 0, rate:  0/s (0/min 0/5min 0/15min);
[2022-02-21 06:33:40 -0800] information/Checkable: Checkable 'frigate.mydomain.com!check-disk' has 1 notification(s). Checking filters for type 'Recovery', sends will be logged.
[2022-02-21 06:33:40 -0800] information/Notification: Sending 'Recovery' notification 'frigate.mydomain.com!check-disk!service-email-notification' for user 'MyUser'
[2022-02-21 06:33:40 -0800] information/Notification: Completed sending 'Recovery' notification 'frigate.mydomain.com!check-disk!service-email-notification' for checkable 'frigate.mydomain.com!check-disk' and user 'MyUser' using command 'mail-service-notification'.
No other logs with recent (i.e. this morning) data:
ls -l /var/log/icinga2
total 804
drwxr-s--x 3 nagios adm      4096 Nov 18 07:43 compat
drwxr-s--x 2 nagios adm      4096 Nov 12 10:14 crash
-rw------- 1 nagios adm         0 Nov 18 07:41 error.log
-rw-r--r-- 1 nagios nagios  70802 Feb 21 10:20 icinga2.log
-rw-r--r-- 1 nagios nagios 640696 Feb 21 00:00 icinga2.log.1
-rw-r--r-- 1 nagios nagios  13122 Feb 20 00:00 icinga2.log.2.gz
-rw-r--r-- 1 nagios nagios   6912 Feb 19 00:00 icinga2.log.3.gz
-rw-r--r-- 1 nagios nagios   6193 Feb 18 00:00 icinga2.log.4.gz
-rw-r--r-- 1 nagios nagios   6869 Feb 17 00:00 icinga2.log.5.gz
-rw-r--r-- 1 nagios nagios   6570 Feb 16 00:00 icinga2.log.6.gz
-rw-r--r-- 1 nagios nagios  33839 Feb 15 00:00 icinga2.log.7.gz
-rw-r--r-- 1 root   adm      2559 Feb 14 20:44 startup.log
I’m not sure where else to look to see if I can determine why that happened.
Thanks for any advice!