Plugins - check_uptime

System and environment info
icinga2 - The Icinga 2 network monitoring daemon (version: r2.13.3-1)
System information:
Platform: Ubuntu
Platform version: 18.04.6 LTS (Bionic Beaver)
Kernel: Linux
Kernel version: 5.4.0-1072-aws
Architecture: x86_64

PHP 7.3.33-1+ubuntu18.04.1+deb.sury.org+1 (cli) (built: Nov 19 2021 06:24:43) ( NTS )
Copyright (c) 1997-2018 The PHP Group
Zend Engine v3.3.33, Copyright (c) 1998-2018 Zend Technologies
with Zend OPcache v7.3.33-1+ubuntu18.04.1+deb.sury.org+1, Copyright (c) 1999-2018, by Zend Technologies

I’m looking to monitor windows system uptime.
I’ve found some documentation online, but I haven’t been able to get it working.
I’m missing the check_uptime plugin file and I’m not able to find one online that works.
Has anyone been able to get this checker to work? If so, how? you have any docs to links to share? possibility the plugin file?

thank you in advance.

I use this monitoring-plugins/check-plugins/uptime at main · Linuxfabrik/monitoring-plugins · GitHub and here is the documentation on how to set it up: Windows checks and Director Baskets of with out director you can extract the information from here

Thank you for all the info. I will start going through it.
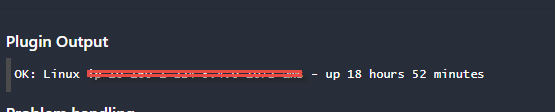
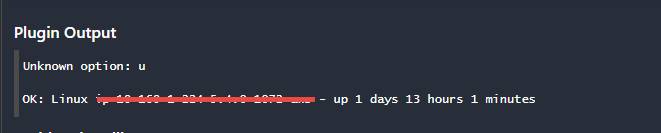
I was able to get the check_uptime working, but it is reporting uptime for my icinga server, not the client.
It seems like I’m close.

The basic one form the ITL is Linux only.

You need to install on the client and you need to have a agent to run it or run it remotely through WinRM.

There are also checks that use SNMP get and uptime accessible via SNMP.

I’m using NSclient++ on the clients and already pulling disk, cpu and mem.

I would like to get uptime now and monitor individual processes/services next.

Thank you again,

~WRD0000.jpg

Then I would try to use the check_uptime that ships in NSclient++ Getting Started - NSClient++ .

Thank you very much for the help, but I’m not going to lie, I’m a little lost right now. I cannot wrap my head around it.
This is what I’m seeing for my Windows machine. Its the uptime of my Icinga server.
image

  • What is the command endpoint of this service?
  • What is the service and command definition of the other checks that work?
  • Did you use the check form the ITL or did you define a new one that utilizes NSClient++?
  • Can you get the uptime from NSClient++ an the windows command line?

I’m not using the NSClient++ and forgot how I did it in the past. Also back then I didn’t use the director.

Dominik, I really apricate your support. Thank you very much.

However, I’m new to Icinga and not familiar with application and terminologies.

Here is what I have in my command-plugins.conf file;

object CheckCommand “check-uptime” {

import “uptime”

arguments += {

“-u” = {

set_if = “$uptime_arguments$”

value = “$uptime_arguments$”

description = “custom description”

}

}

vars.uptime_arguments = “days”

}

The config in my services.conf file

apply Service “UPTIME” {

import “generic-service”

check_command = "check-uptime "

vars.uptime_unit = “days”

vars.uptime_warning = “280”

vars.uptime_critical = “300”

assign where host.vars.os == “windows”

}

Here is the output, which is the update from my Icinga server.

image001.png

~WRD0000.jpg

will be searched in the location defined by “const PluginDir” in /etc/icinga2/constants.conf.
You wrote, that you have other checks on the host that use NSClient++ and work, how does the object CheckCommand look for them?
How does the “object Service” look that is using the CheckCommand “check-uptime”?

If I remember correctly, the last time I used the NSClient++ my config looked something like this: Cambodia Kingdom Of Wonder: Icinga2 monitor windows host with nsclient++ software

Thank you very much, I think I got it working.

image001.png

I just need to figure out how to display the uptime in days

Maybe there is a verbose flag/argument that will change the “OK all counters within bounds” to the Status and the actual uptime.

I’m referencing this site, but I’m having a hard time make sense of it.

https://exchange.nagios.org/directory/Plugins/System-Metrics/Uptime/check_uptime–2F-check_snmp_uptime/details

you are using SNMP now and not NSClient++?

I was able to figure it out. Thank you Dominik for all your help.

I use centron plugin to get uptime via snmp